How to add highlights to your charts
Highlights are important if want to draw the attention of the reader of your report on one specific element of the visualization. For example if it is imperative to delivering your main message. With Zebra BI you can therefore easily emphasize important sections in your business chart or report – it just takes one click!
Single value highlights
To emphasize a single value, click to select a chart, hover over the desired column and click on the blue “+” button that appears:
IMPORTANT:
Zebra BI will highlight the data element by its name, not just color a fixed column. This means that if the highlighted element will change its position upon refreshing or filtering your source data, the highlight will move along with the element!
Zebra BI will color the selected data element with the default highlight color defined in reporting standards (Notation). Alternatively, it can be colored according to a specific color code from the Glossary of Reporting Terms. However, Zebra BI can only do so if the name of the selected data element matches one of defined reporting terms.
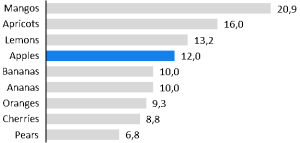
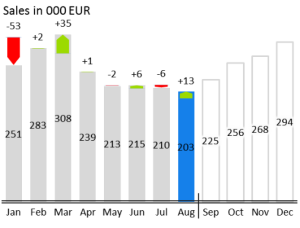
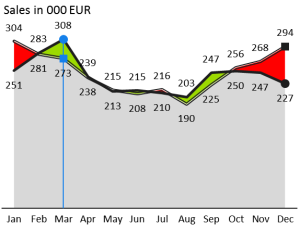
This is how highlights look like in different charts and styles:


Multiple value highlights
To emphasize a data element in a small multiples report, click to select any chart inside the report, hover over the desired column and click on the blue “+” button that appears. Zebra BI will color the selected element in all charts of the report at the same time
Removing highlights
Removing the highlights is just as easy. Just hover over the highlight you want to remove and click on the red “x” button that appears.