Applying styles to charts
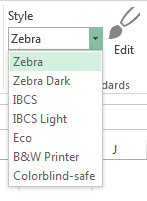
When you insert a chart, Zebra BI will automatically design it according your selected default style. You can see which style is currently the default style by checking the drop down menu under Reporting standards of the Zebra BI ribbon:

To change the default style, just select your desired style from the drop down menu. This setting will be remembered even after you close Excel.
Note that this setting only affects new charts that you’re inserting. Changing the default working style will not affect existing charts in the current worksheet or other worksheets in any way.
Of course you can apply a different style to existing charts on your worksheet at any time. You can even apply styles to whole reports (small multiples or a group of scaled charts).
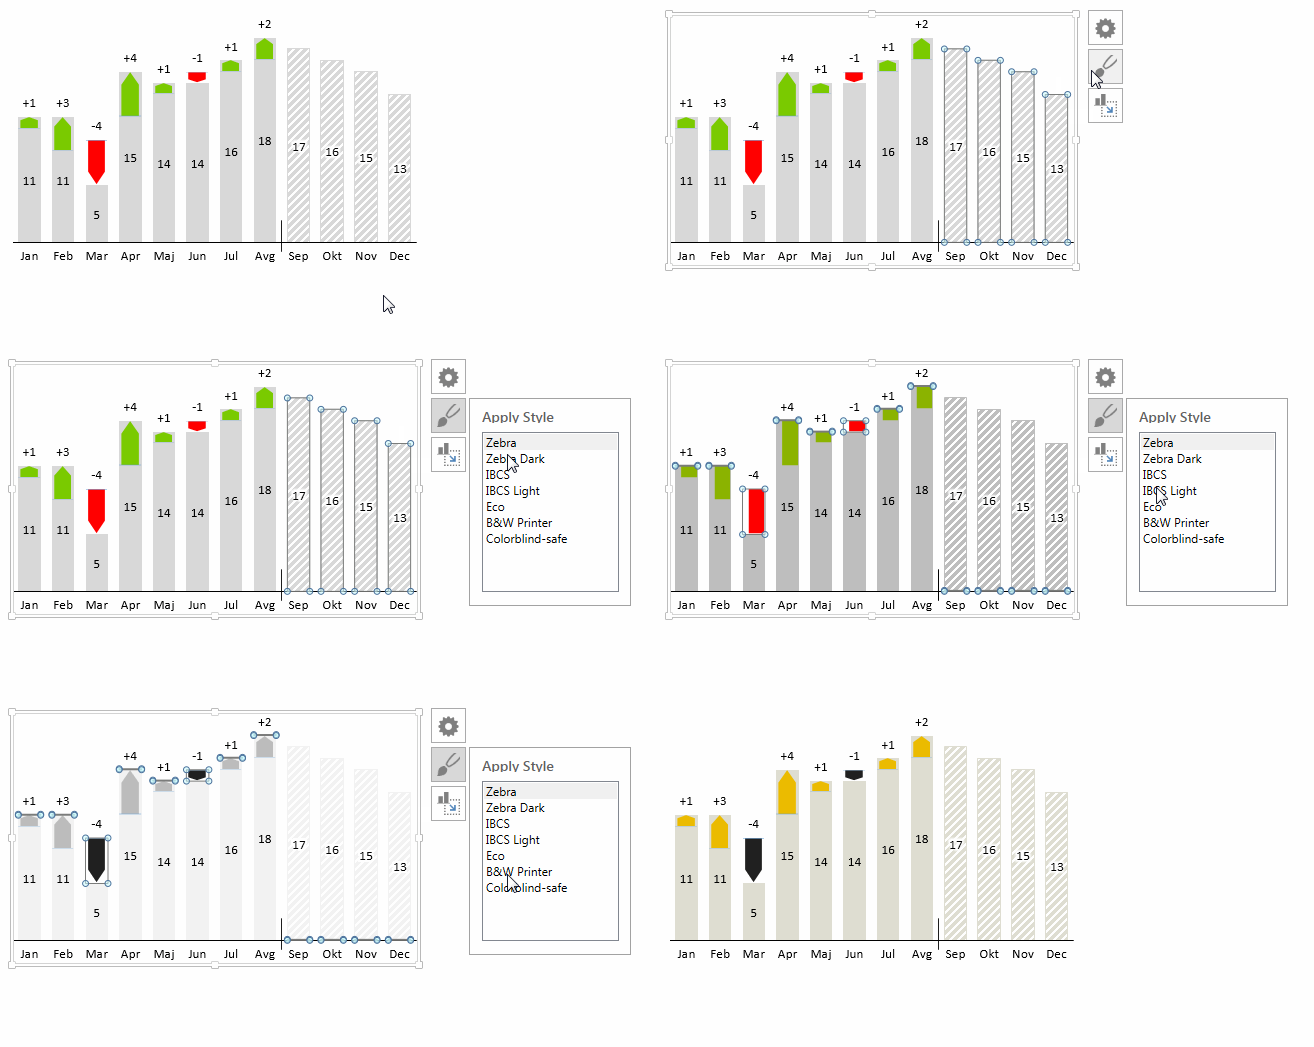
Here is how you do it. First click on the chart, then click on the style icon. A new dialog will open, listing all the styles that you have previously defined in reporting standards. When you put your mouse cursor over its name, the style will be applied to the chart so that you can preview it. To confirm your selection just click on the style name:

Zebra BI is shipped with carefully prepared reporting standards, based on IBCS notations (International Business Communication Standards). We advise you to use the built-in standards as much as possible and only make adjustments when necessary. For example to align reporting standards to your corporate image or to include specific color or shape definitions. In any case we advise you not to prepare too colorful styles – the power of communication will probably just be degraded.
Check the article How to edit styles for information on how to change colors, shapes, fonts and scenario labels in styles.
