Using Zebra BI Data Editor
In Zebra BI 2.0 we introduced a Data Editor – a new button on Zebra BI charts that allows you to change the source data of inserted charts.

Preparing data for Zebra BI. From simple data tables to Pivot tables, PowerPivot or data from 3rd party tools like SAP Business Objects Analysis for Office.
In Zebra BI 2.0 we introduced a Data Editor – a new button on Zebra BI charts that allows you to change the source data of inserted charts.
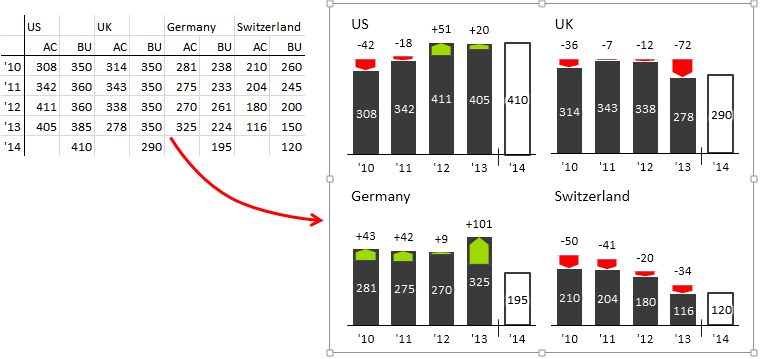
One of the most powerful features of Zebra BI is that it enables you to create several charts from your data in one single click. All the charts are automatically scaled so that the values can be compared across all charts. Such a report is called “Small Multiples” and this article will teach you how to prepare the data for it.
Sometimes you’d like to add new data (new months, new products, …) to the Zebra BI charts. There are 3 ways you can do that, depending on whether you want to add new data categories at the end of the chart or in the middle.
Since Zebra BI 2.0 you can insert Zebra BI charts from data that is not necessarily in a single block. Essentially this means you no longer have to create separate tables that have correct data structure for Zebra BI charts.
Correctly preparing data is important if you want Zebra BI (or any other reporting tool for that matter) to produce meaningful visualizations. Fortunately, we have managed to make this extremely simple in Zebra BI 🙂
Below you’ll learn how to structure your data tables, how to name your column headers and you’ll see a visual representation of how Zebra BI creates a chart from your data table.