Creating Small Multiples
Edward Tufte, one of the leading authors on information design, discussed the value of high-information graphics in his work “The Visual Display of Quantitative Information” (1983). He identified a method of repeating small-sized charts in a two-dimensional matrix or grid and named this method “Small multiples”. In his later work Envisioning Information (1990) he claims:
For a wide range of problems in data presentation, small multiples are the best design solution.
– E. Tufte, Envisioning Information (1990)
Small multiples are also called trellis chart, grid chart, panel chart, multipanel chart or lattice chart, while Jacques Bertin proposes a similar visualization method called Reorderable Matrix in his incredible work Sémiologie Graphique from 1967 (English translation published in 1983 as Semiology of Graphics: diagrams, networks, maps).
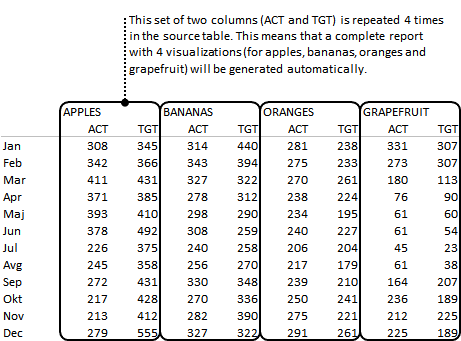
Because of the importance of small multiples in information design, Zebra BI was carefully designed to offer a strong support for this visualization method. Creating a small multiples report is a simple one-step procedure. First you have to prepare your data in a suitable format, repeating the data columns for each small multiple. Below is an example of the correct source data table for a small multiples report with 4 charts. The value area is repeated in columns for each small multiple (product), while the data category (months) is provided just once at the beginning of the data table:
To create a small multiple report, you just have to click on any cell inside this data table and select the desired visualization from the Visualize group on the ribbon. For example:

A complete small multiple report will be created in one single step. Note that Zebra BI has scaled all the visualizations of the report correctly. The synchronization of scales is necessary, so that the reader can correctly assess the impact of the displayed values.
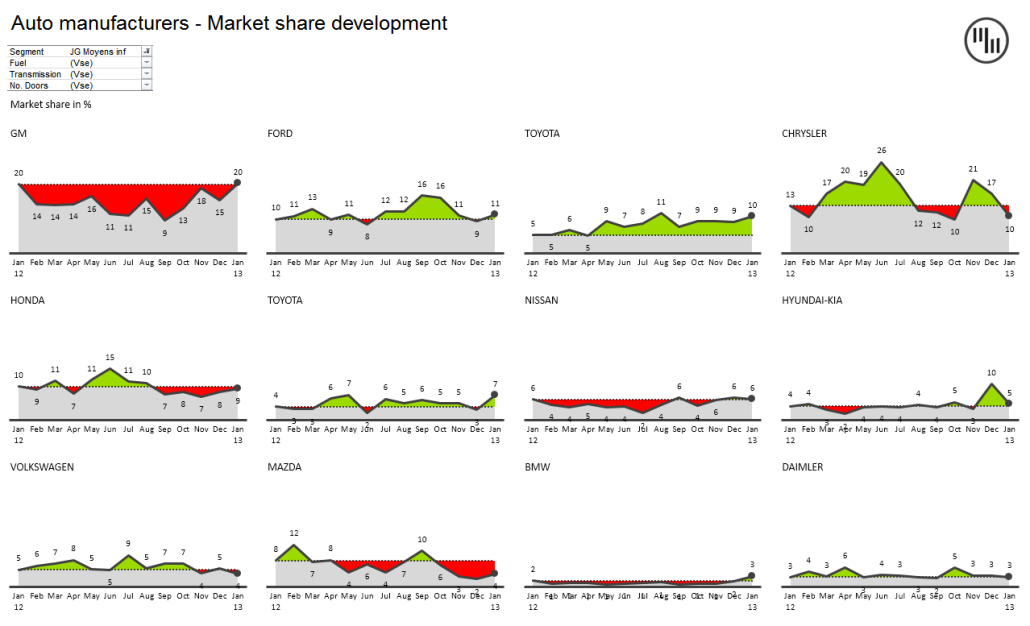
Here is an example of an even more ambitious report with 12 charts comparing actual sales to target values in a 4×3 layout (also created with one single click from a source table with data of 12 products):
Manual creation of Small Multiples
You can also create a small multiple report manually from several independent visualizations. In most cases this will not be necessary.
First insert visualizations from separate data tables. Then you select several visualizations by pressing the SHIFT key on your keyboard (or the CTRL key, alternatively) and click on the charts. This way you can select several charts. Then select the Group Small Multiples command from the Report section on the Zebra BI ribbon:

Zebra BI will align the selected charts, synchronize the scale of all charts and provide a text box in which you can specify the key message of the report.
To break the report apart, you select the report and then click the Ungroup button: