
How to edit styles
In Zebra BI, reporting standards are defined by so-called styles (or management notations). You can take advantage of several predefined styles, but you can also modify them or create your own reporting standards. On top of that, you can share your styles with any number of other Zebra BI users.
Edit Style
In this article we’ll describe how you can edit (modify) existing styles to suit your specific reporting needs or to make sure they’re aligned with your branding.
Please note that you can also add your own (completely new) style. In fact, you can create as many as you please. In this way you can, for example, define your own corporate reporting standards or simply create a separate style with specific color and other design definitions that you need for a specific purpose.
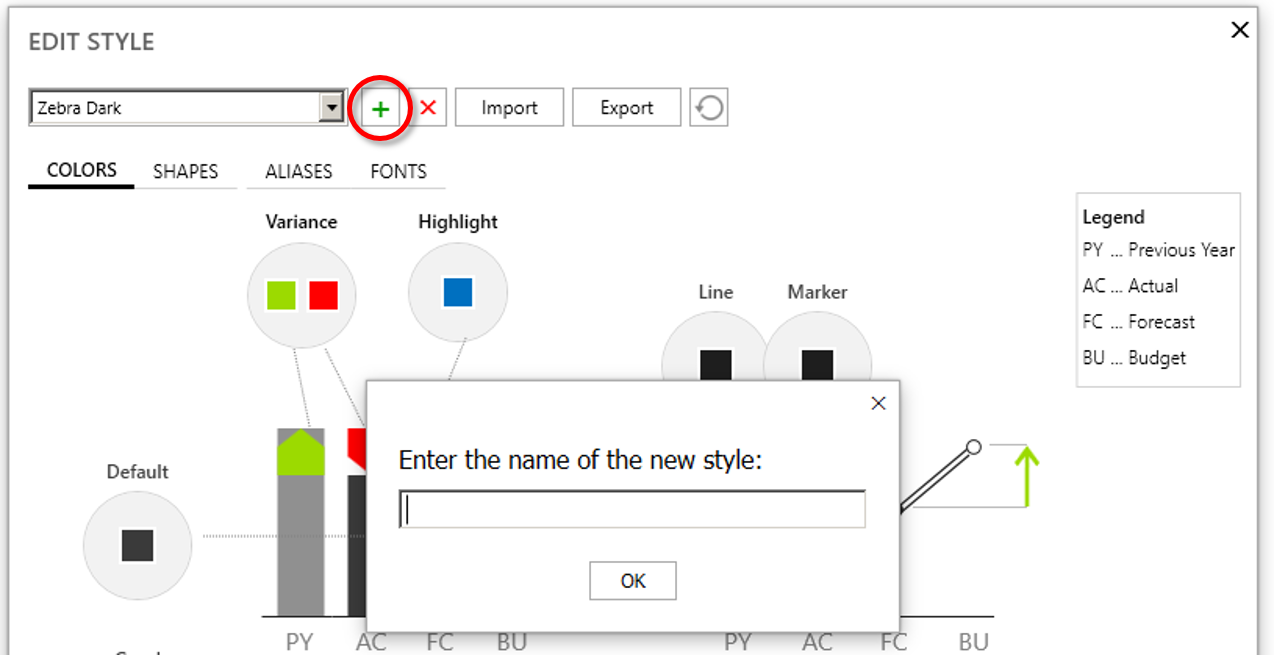
To add your custom style, click on the plus (+) icon. A copy of the currently selected style will be created and you will be prompted to enter the name of your new style in the input box:
The styles can be distributed between several users to ensure that every report designer in an organization produces a consistently designed, standardized report. For importing or exporting styles, click on the Import or Export button, respectively.
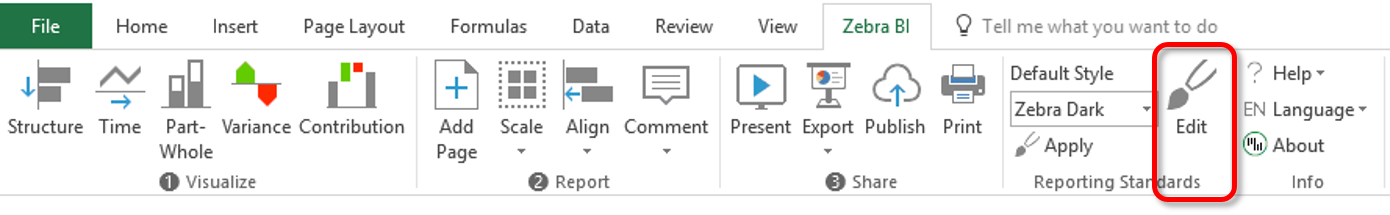
OK, now let’s dive into the details of modifying styles. Click Edit Style on the ribbon and a new window will open:
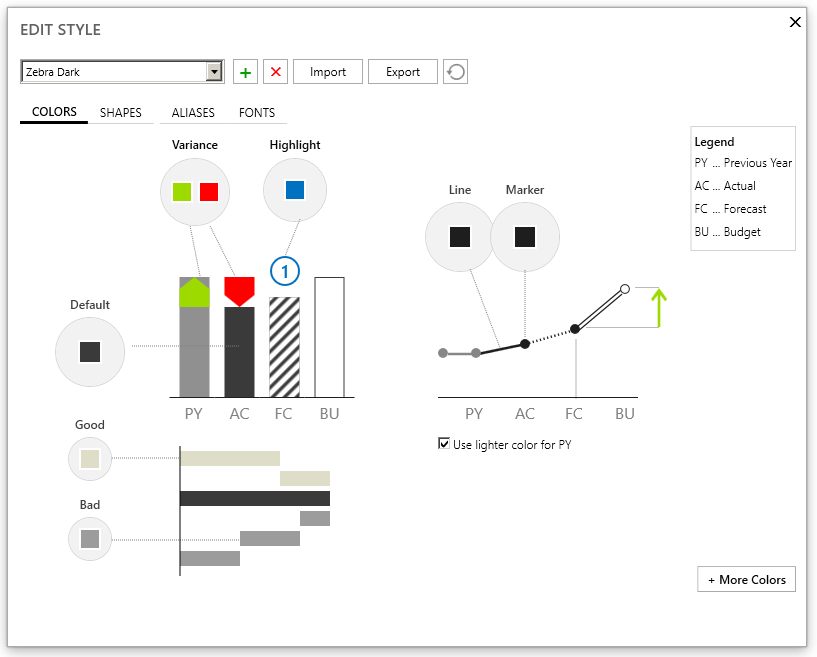
The name of the style you’ll be editing is displayed in the drop down menu at the top of the window. Make sure this is the right one, otherwise select another style from the drop down menu.
Below, you’ll find the following 4 sections (tabs) that contain style definitions:
- COLORS; here you can change the colors that will be applied to charts and reports
- SHAPES tab contains options for shapes used in the charts
- ALIASES tab lets you assign or change the data labels for business scenarios Actual, Previous Year, Forecast and Budget
- FONTS section lets you define font-related options
Colors
Here you specify the default color scheme within the selected notation. You can customize the default (neutral) chart color, the color for “good” and “bad” KPIs (e.g in waterfall charts), variances, highlights, lines and markers.
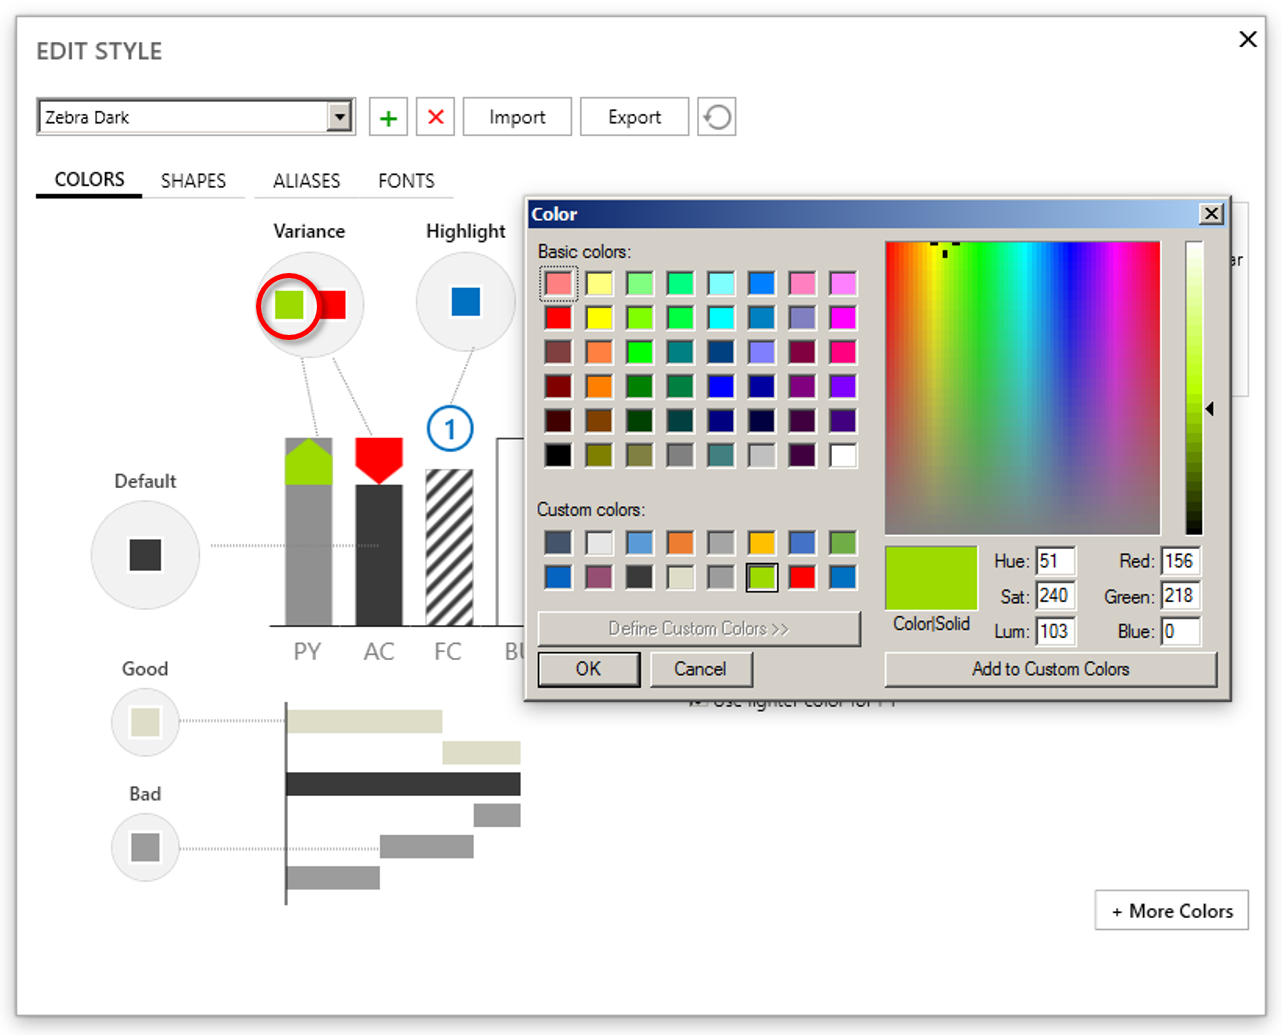
You change the color by clicking on the colored square. A color picker dialog will open where you select your color or enter an exact RGB color value:
If you click on the “+ More Colors” button on the bottom right, additional advanced options will be revealed:
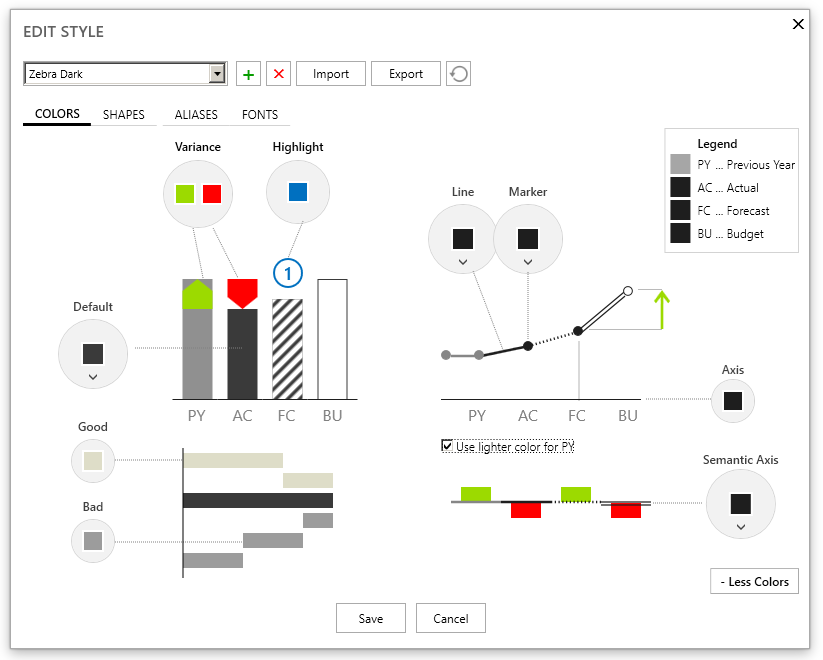
Now you can set the following additional colors:
- color for each business scenario
- axis and semantic axis colors
Additionally, you can set Line, Marker, Default and Semantic Axis to use Scenario colors instead of specified colors. Click on the small down arrows (∨) to change these settings.
Shapes
In this tab you specify the shapes that will be used in the selected style:
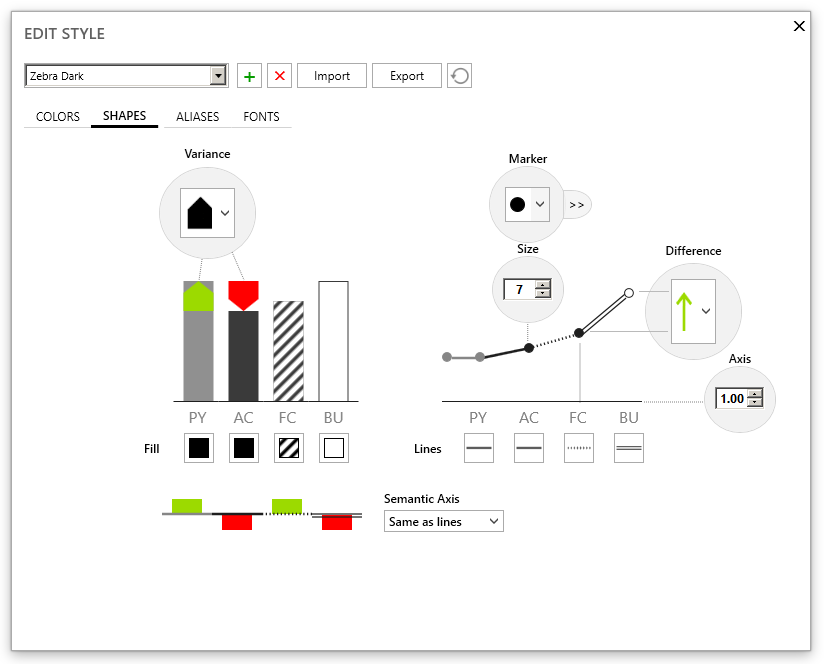
You can change the shape of any element by simply clicking directly on it.
You can set a standard shape for:
- variances, fill patterns and borders in column and row charts,
- marker shapes & sizes and line patterns in line and dot charts,
- shape of difference highlights,
- axis width and patterns.
Advanced options in this tab include:
- specifying a different marker shape for each scenario (click on the “>>” button to reveal these options)
- setting semantic axis patterns for each scenario (by default these patterns are the same as patterns for Lines)
Aliases
Aliases are labels that represent a particular business scenario in your source data. By default, Zebra BI will understand standard data labels, such as PY, AC, FC, BU, PL, etc.
However, you can you change or add aliases. For example, you can add scenario labels for your local language or change existing labels to match the ones that you’re already using in your data sources. You can add as many aliases as you need, there is no restriction. So for example you can assign multiple aliases for the forecast scenario label, like: FC, FC1, FC2, FC3, …, LF, LF1, LF2, etc.
To add a new alias to a business scenario, simply write it in the last (empty) row and press Enter on your keyboard. To delete an alias, click on it and press Delete on your keyboard.
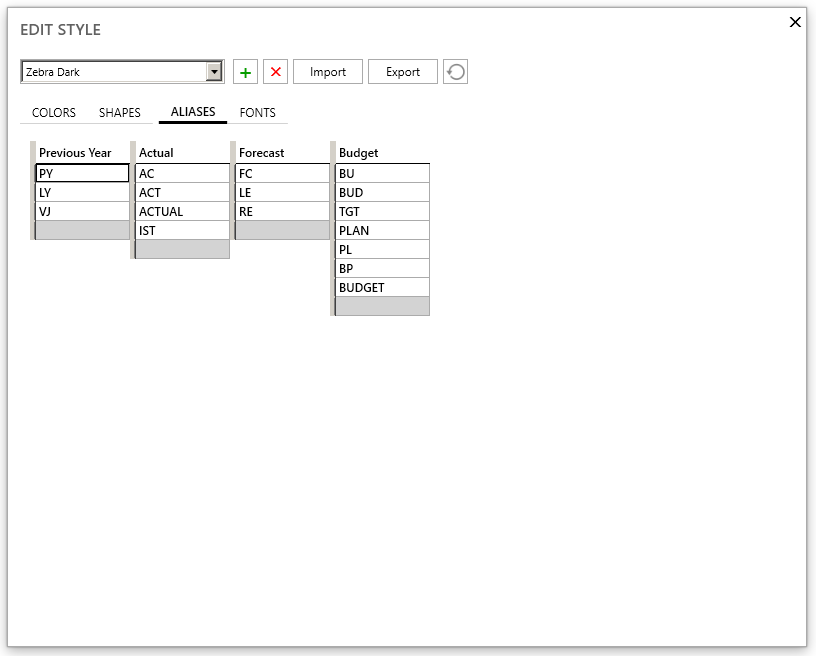
NOTE: If you’re using more than just 1 style in your reports and you have defined your custom labels for scenarios, make sure you change aliases in all the styles you’ll be using.
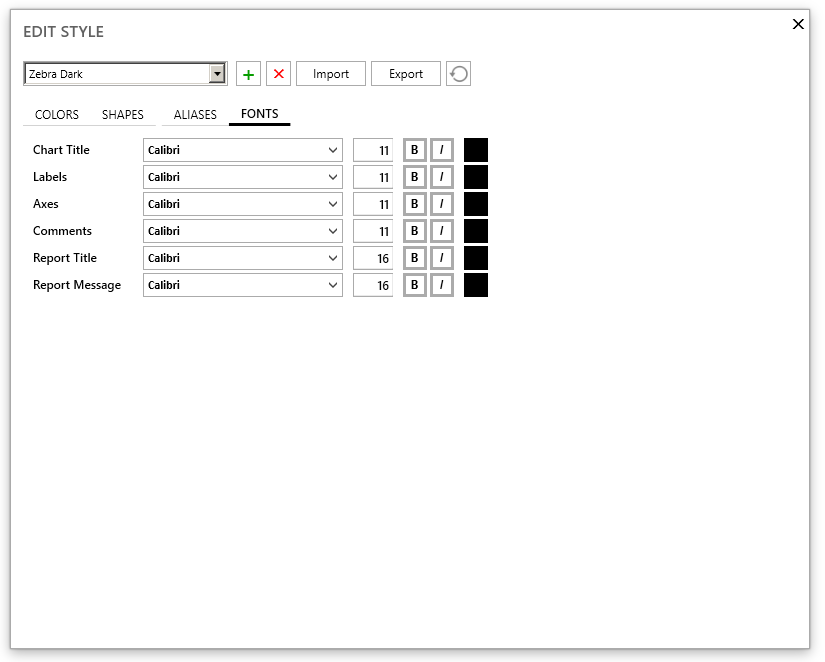
Fonts
The fourth tab lets you specify your desired fonts, font sizes and colors for all different kinds of labels.
What’s next?