
How to Prepare Your Data
Correctly preparing data is important if you want Zebra BI (or any other reporting tool for that matter) to produce meaningful visualizations. Fortunately, we have managed to make this extremely simple in Zebra BI 🙂
Below you’ll learn how to structure your data tables, how to name your column headers and you’ll see a visual representation of how Zebra BI creates a chart from your data table.
Exploring the basic data structure – a table
Data in a table is arranged in rows and columns. We use row headers and column headers to give meaning to the values in your table:
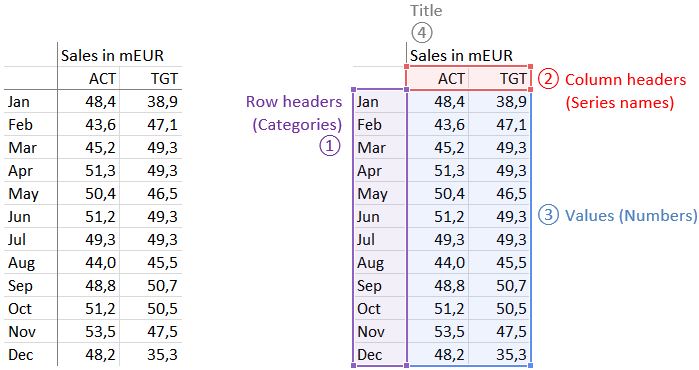
Basic structure of source data table
-
- Row headers are written in the leftmost column. They represent data categories, for example time periods, product names, sales regions, customer names, etc. In some cases two columns can be used for row headers (e.g. when inserting a waterfall chart).
- Column headers are written in the first row. They represent the series names. In business reporting they often describe the type of data in each column, for example “Previous year”, “Actual”, “Budget”, etc. See below for more details on column headers.
- Values should always be numbers, never text! Well, some of them can also be empty or have a “not available” value (#NA value in Excel).
- Title is optional. If you want to display the title in a chart, than write it exactly above the first column header.
3 basic rules for preparing data in Zebra BI
When preparing data in a table, just make sure you follow these three simple rules and Zebra BI will produce meaningful results:
1. Avoid empty rows or columns
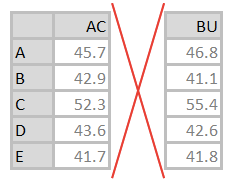
Avoid empty rows or columns between the data!
2. Put text left, numbers right
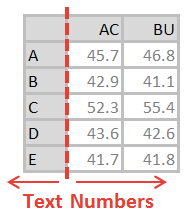
Put data categories (usually text) on the left side and numerical values (numbers) on the right side of the table.
3. Use meaningful column headers
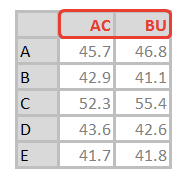
Headers (column names) should match the names defined in reporting standards.
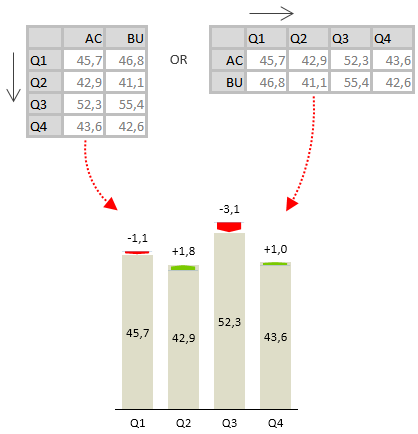
You can use horizontal tables as well!
Sometimes when working with time series tables it makes sense to put data in a horizontal table: Months (or quarters or years) as columns and categories as rows (see the picture below).
Don’t worry, Zebra BI can handle these kinds of tables as well:

Place time periods in rows or columns
What do you mean by “Meaningful column headers” ?
In business reporting you’ll often deal with so-called business data scenarios. They represent different types of business data, such as “Previous year”, “Actual”, “Forecast” and “Budget”.
For practical reasons we typically use abbreviations for business scenarios. The standard abbreviations are:
| Scenario | Standard & other acceptable abbreviations | Short description |
| “Previous year” | PY, LY, VJ | Actual data of the respective period (month, quarter, year) of the previous year. |
| “Actual” | AC, ACT, Actual, IST | Data of the currently running period or the last completed closed period. |
| “Forecast” | FC, LE, RE | An updated plan or budget (see below) in the course of the running year. |
| “Budget” | BU, BUD, TGT, Plan, PL, BP, Budget | The approved plan for one future year. A plan is the anticipation of future results. |
Labels PY, AC, FC and BU are most standard abbreviations for business scenarios. Furthermore, they are recommended by International Business Communication Standards (IBCS). That’s why we strongly recommend that you use these standard labels in your organization as well.
A visual representation of Zebra BI at work
Ok, now let’s observe an example, how specific parts of your data table are displayed in a Zebra chart:

Please take note of the following advanced features:
- The title is displayed as chart title at the top-left position.
- This time row headers (categories) consist of two columns: (3) represents category names while (4) represents additional category class names or labels, which (if present) are displayed below the axis labels.
- The values in the first value column (AC – “Actual”) are only present until August. The last four values are #N/A. This is intentional because Zebra BI charts work best if “empty” data cells are filled with #N/A values. Zebra BI treats these values as non-existent and produces a chart with two business scenarios (actual values until August, budget values for the rest of the year).
Congratulations, you’ve just learned the most important points of preparing the data for visual analysis in Zebra BI!
Of course, there are some more details and advanced options, specific to some Zebra charts. You will learn them along the way, when you explore Zebra charts in more detail. Hint: Especially exciting is the option of inserting multiple charts from a single data table with just one click (read Preparing data for “Small Multiples” report to learn how to do this).
Wait… just one more thing:
The data structure, that we have just described, is in fact a completely standard Excel data table, right? The good thing about that is that you can prepare such a table in numerous ways and with several technologies within Excel. Just think about it – you can use:
- Plain Excel cells with values and/or formulas, that you just enter manually or possibly link with Excel formulas.
- Pivot Tables, that can be inserted either from Excel data or connected directly to external data sources.
- OLAP Pivot Tables, connected directly to OLAP data sources, such as MS Analysis Services.
- PowerPivot tables.
- Data tables created with popular Excel analytic tools, such as SAP Business Objects Analysis for Office, SAP BPC/EPM, XLCubed, Tagetik, Jedox and many others.
We have designed Zebra BI to work with all of the above-mentioned technologies! That’s one of the features that make Zebra BI a powerful reporting tool, regardless of how you extract and prepare your data. That said, you have many options to completely automate your reports as well…
What’s next?