
Preparing Data For a “Small Multiples” Report
One of the most powerful features of Zebra BI is that it enables you to create several charts from your data in one single click. All the charts are automatically scaled so that the values can be compared across all charts. Such a report is called “Small Multiples” and this article will teach you how to prepare the data for it.
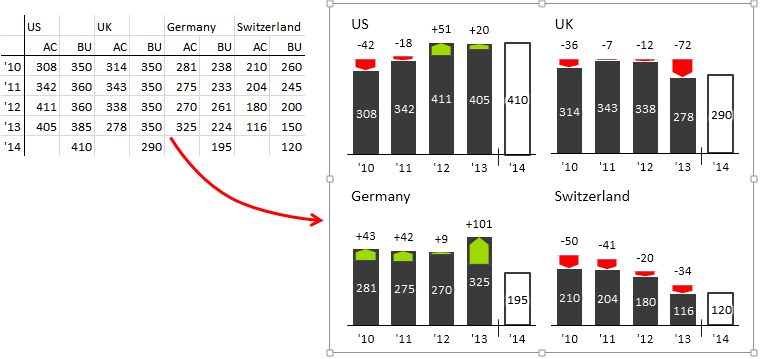
If the value area of the source table consists of repeating sets of columns, Zebra BI will detect the repeating pattern in the data and produce a »small multiples« report in one single step:
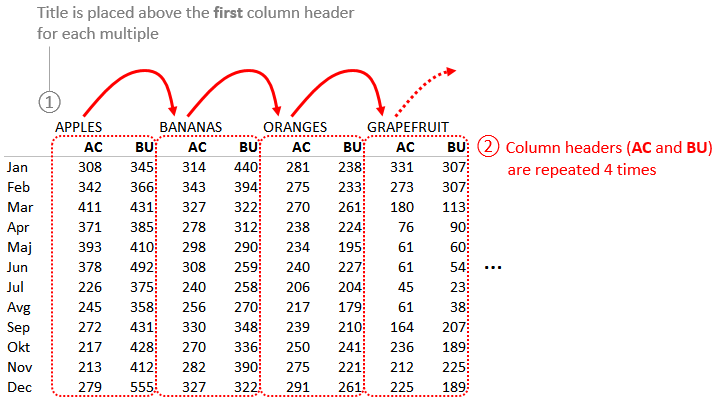
Table for small multiples: Just repeat the column headers several times.
In this case, the table header has two rows: The first (top) row represents the title of your data elements – multiples (in our case 4 products) while the second row contains column headers (AC, BU). These column headers must be exactly the same for all data elements!
Similar to creating a single chart, the titles of the data elements (Apples, Bananas, etc.) have to reside above the first column of each data element.