The new Zebra BI for Office is now available! While we'll keep the old Zebra BI Excel add-in running, the future and major updates are in this new version. We recommend switching to get the best features.
Learn more

Update Zebra BI Viewer

Hi, it appears you already have the latest version of Zebra BI Viewer! No need to update.

Get the Latest Update

Zebra BI Dynamic Viewer 2.3.0

Update Instructions:

1. Close all Excel windows
Close Excel

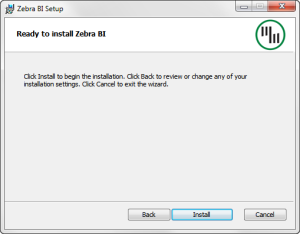
2. Run ZebraBIViewer_Setup.msi

Zebra BI Chart Make Install Setup

3. Start Excel

… and enjoy the new features!

What’s New?

New Features:

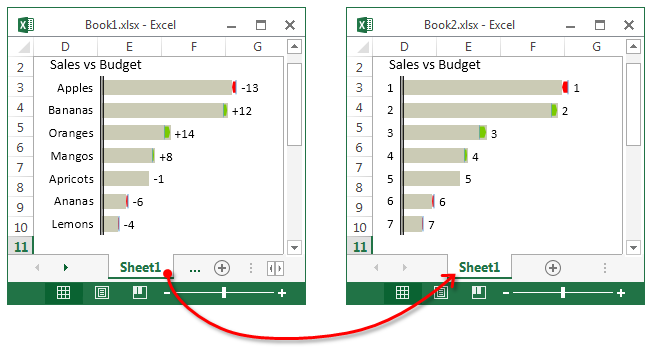
  • Zebra BI now supports copying and moving worksheets into another workbook (or a new workbook)!
    This was one of your most frequent requests, so we’re very happy it now works natively. Just copy/move your sheets as you would normally do in Excel.

    move-or-copy-sheets-to-workbook

    Move or Copy worksheet into another Excel workbook

Enhancements:
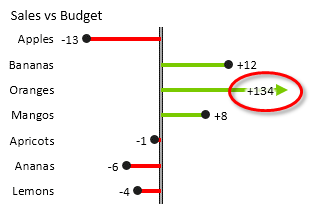
  • Improved formating of the outlier label:
    improved-formatting-of-outlier-labels

Bug fixes:

  • Fixed the issue with inserting plus-minus chart from two rows

New Features:

  • Excel 2016 is out and Zebra BI now supports the 32-bit version of Excel 2016 (the 64-bit version will be fully supported in the next release of Zebra BI)Zebra BI for Excel 2016
  • Здравствуйте, Zebra BI now speaks Russian. To switch to Russian, select Русский from Info > Language

Enhancements:

  • We’ve improved the label positioning on charts. Especially when the charts are small.
  • Scaling on plus minus charts now also takes inverted rows into consideration

Bug fixes:

  • Fixed an issue with changing the variance to relative on segmented plus minus dot charts
  • Fixed an issue on charts with multilevel categories which were not aligned if only the “-” symbols were used
  • Fixed a problem with scaling contribution (waterfall) charts (resizing the charts caused the axis to become too think or too thin)

New Features:

  • Zebra BI is now available in the Portuguese language!

Enhancements:

  • All charts now support multilevel axis labels
  • Improvements in label display on charts in Excel 2013
  • Improved commenting: the font for comment text boxes is now applied from the style
  • Stability improvements

Bug fixes:

  • Fixed a problem with Min and Max limit on plus-minus dot chart, created from one column

New Features:

Page Templates make it really easy for you to create standardized report pages or slides. We added several page templates for reports with multiple charts, classic table-chart combinations, ROI trees, etc. They are all perfectly sized to fit PowerPoint slides or scale exactly to A4 paper size. Just click “Add Page” and choose the most appropriate template! It gets even better, you can customize the templates or develop your own and then share it with other people.

Limiting outliers in plus-minus variance charts. Now you can set a limit for max or min value and every value that exceeds those limits gets cut off at the limit and displayed with an arrow instead.

The “Comment” section of the Zebra BI ribbon has been significantly expanded. The new additions include:

  • The ellipse for highlighting important values
  • The text-box for adding floating comments
  • The four IBCS “scenario markers” for formatting table columns
  • Four commonly used symbols (delta, sum, average and dot)
  • Eight arrow symbols for indicating trends

Enhancements:

  • The ability to move the legend from right to left in part-whole charts
  • The Croatian translation. If you’re a Croatian-speaking user, you can change your interface language in Info > Language in the Zebra BI ribbon.
  • Support for different PowerPoint slide sizes (classic 4:3 or widescreen 16:9)
  • Improved creation of linked PowerPoint slides

Bug fixes:

  • several bug fixes

New features:
We’ve added the Butterfly chart! See examples in worksheet 8 in Help > Getting Started Tutorial
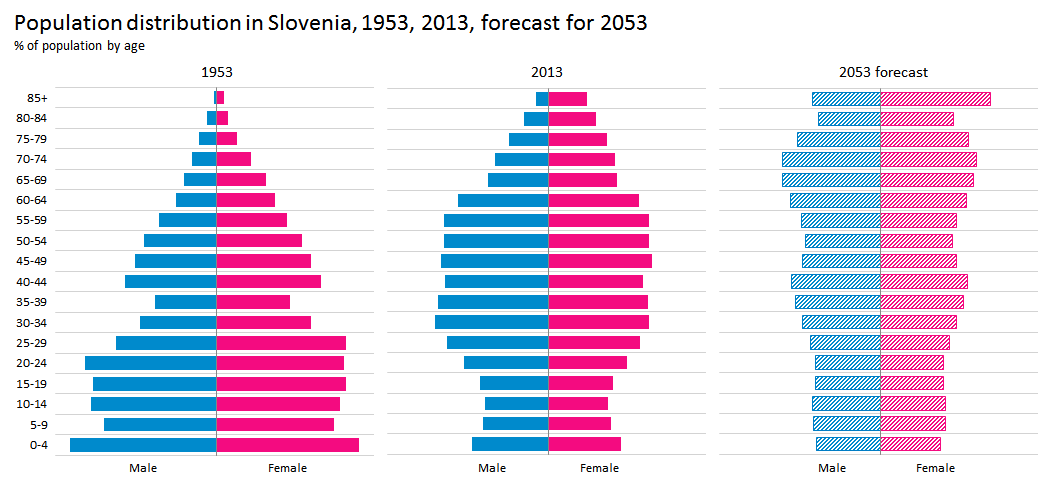
Population-pyramid-Slovenia-1951-2013-2053

¡hola! Zebra BI now speaks Spanish.To switch to Spanish, select Español from Info > Language

Enhancements:
The contribution structure chart (black&white waterfall chart) is created as multiple chart if data for more scenarios is detected (e.g. two columns with PY and AC or AC and BU)

Bug fixes:

Fixed a problem with creating single series time charts that have all 4 scenarios (PY, AC, FC, BU) – data parsing is improved
Fixed a problem when inserting contribution (waterfall) chart which only had fixed column in the last row

New features:
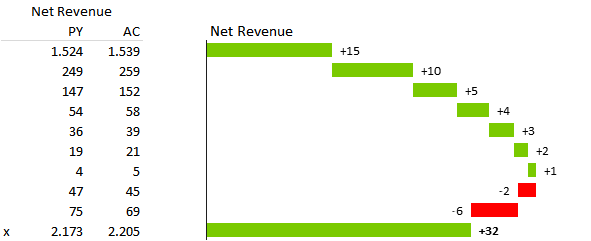
Contribution charts now support subtotals / subcalculations!
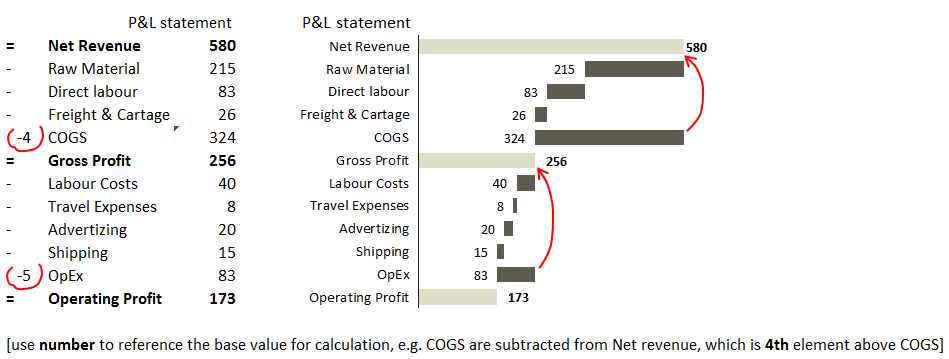
Contribution subtotals

Enhancements:
Added “=” as a fixed column identifier in waterfall charts (both “X” and “=” can now be used).
Improved logic for displaying Zebra BI context buttons
Added optical correction for displaying scenarios with very light colors (border)
Improved calculation engine check for 64bit versions of Excel.

Bug fixes:
Fixed a problem with sorting on worksheets with long worksheet names.
Fixed an issue with ref error when all data for a contribution chart is deleted.
Fixed an issue with semantic axis and delimiters when grouping Part Whole charts.
Fixed an issue with ungrouping Part Whole charts.

You can now copy any worksheet and then continue working on the copy with Zebra BI!
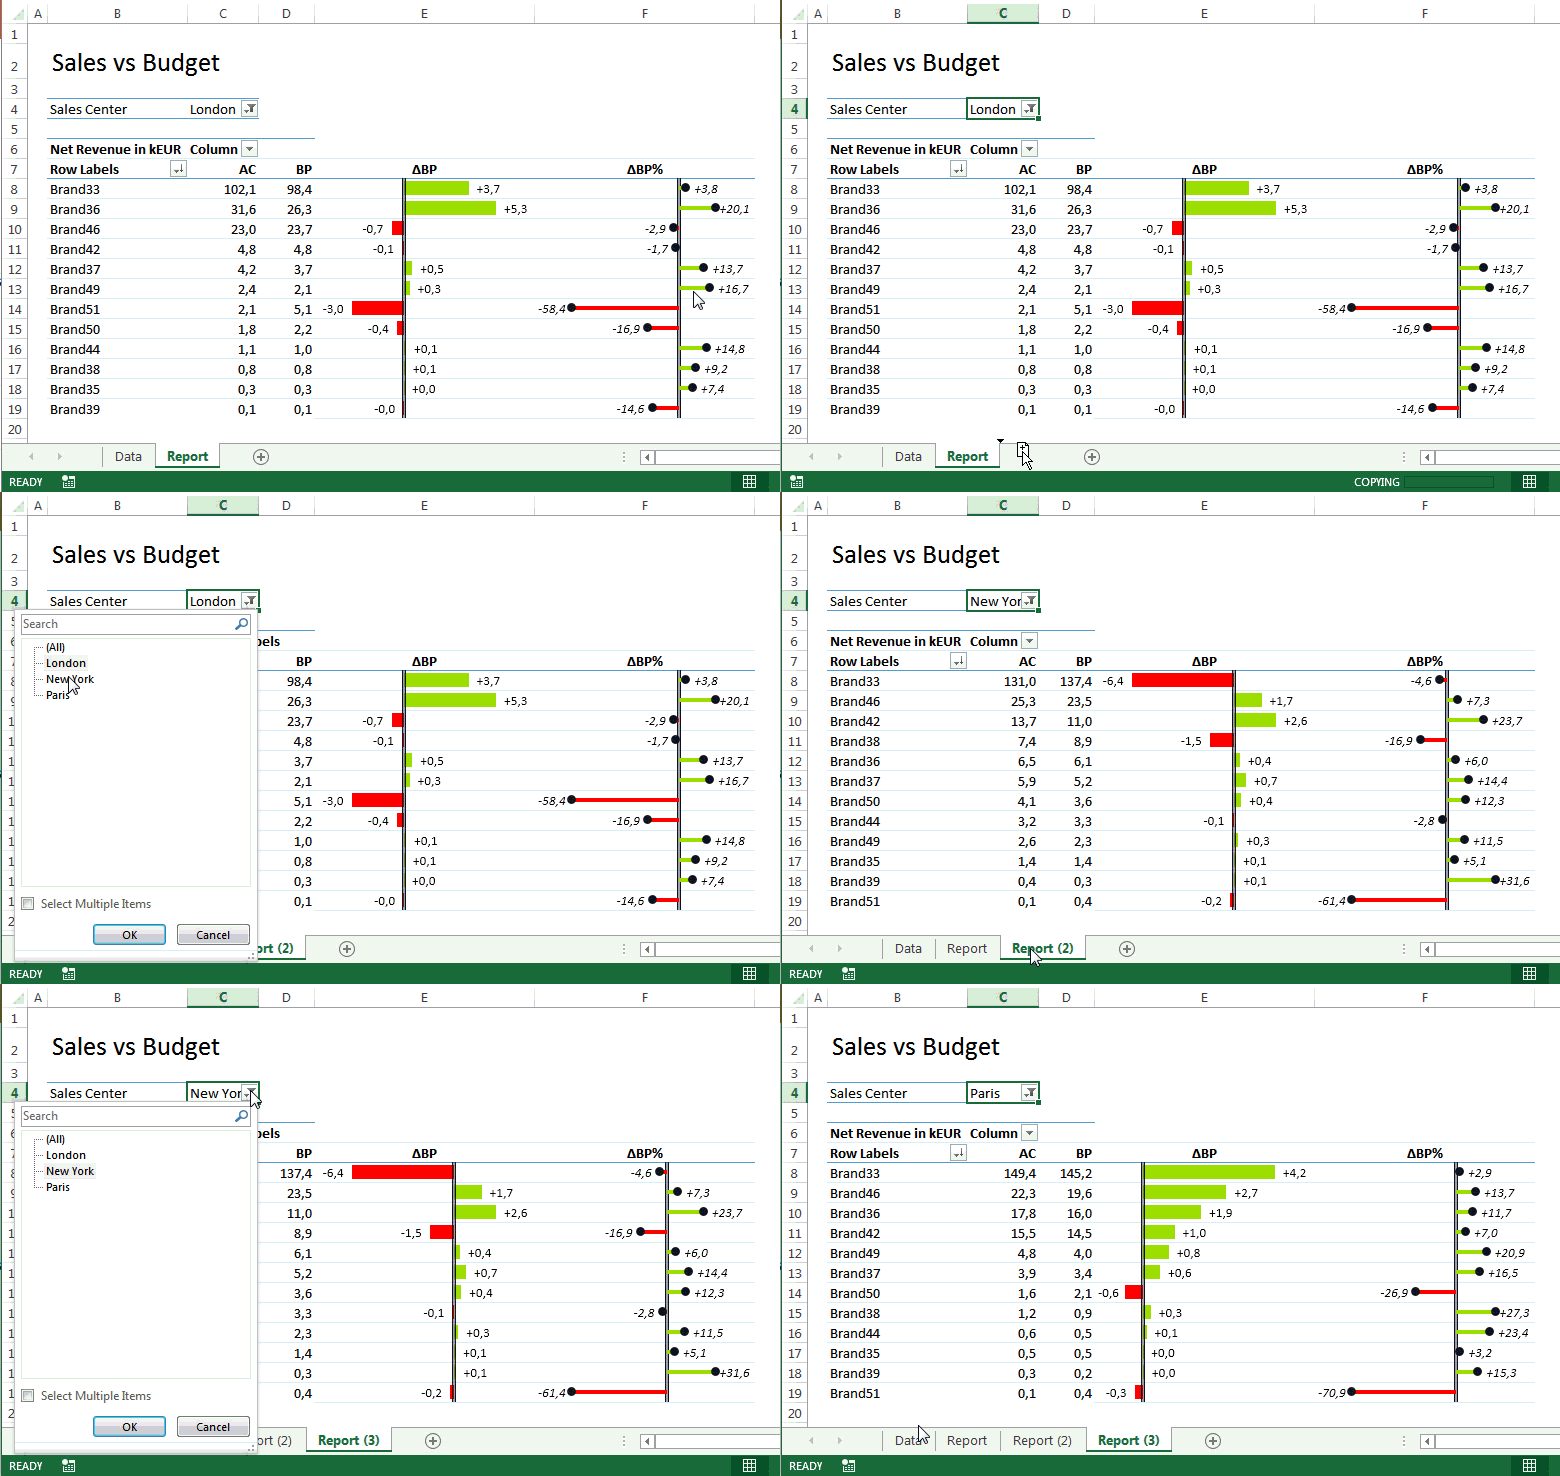
Copy worksheet

  • New features:
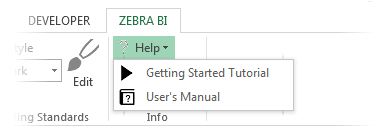
    Completely new Getting Started Tutorial, available under Help > Getting Started Tutorial:
    Getting-Started Tutorial in Zebra BI
    You simply must try this! Test yourself: do you know all the key features of Zebra BI?
  • Enhancements:Improved data parsing for part-whole, contribution and variance charts
    Improved positioning of chart and report settings icons while moving charts.
    Improved positioning of charts and reports when they are created
    Improved Move Chart function.
    Improved design of user forms.
  • Bug fixes:Fixed #REF errors ocurring in some cases when Excel worksheets were deleted
    Fixed a problem with grouping waterfall charts without categories.
    Fixed the legends in part whole chart when the series do not have names (empty legend).
    Fixed a problem with grouping and ungrouping multiple structure charts.
    Fixed axis labels position on structure charts when in multiples.
    Fixed the axis label position on time charts when ungrouping.
  • improved data recognition for the Contribution chart without categories, e.g.:

Contribution-without-categories

  • improved localizations on Zebra BI ribbon
  • improved application of borders to Plus minus and Contribution chart
  • improved the speed of manually grouping the Charts
  • improved positioning of the Charts in Small Multiples
  • improved positioning of Small Multiples report when it is inserted
  • demo and updates Workbooks are now included with the installation
  • added a check to see if the decimal symbol and group separator use the same character
  • fixed an issue with copying between Workbooks
  • fixed an issue with relative variance calculation
  • fixed an issue with the patterns not applying after changing them in the Styles window
  • fixed an issue with copying the ranges between Excel workbooks
  • Significant speed improvements – small multiples and groups of several scaled charts now work up to 10x faster
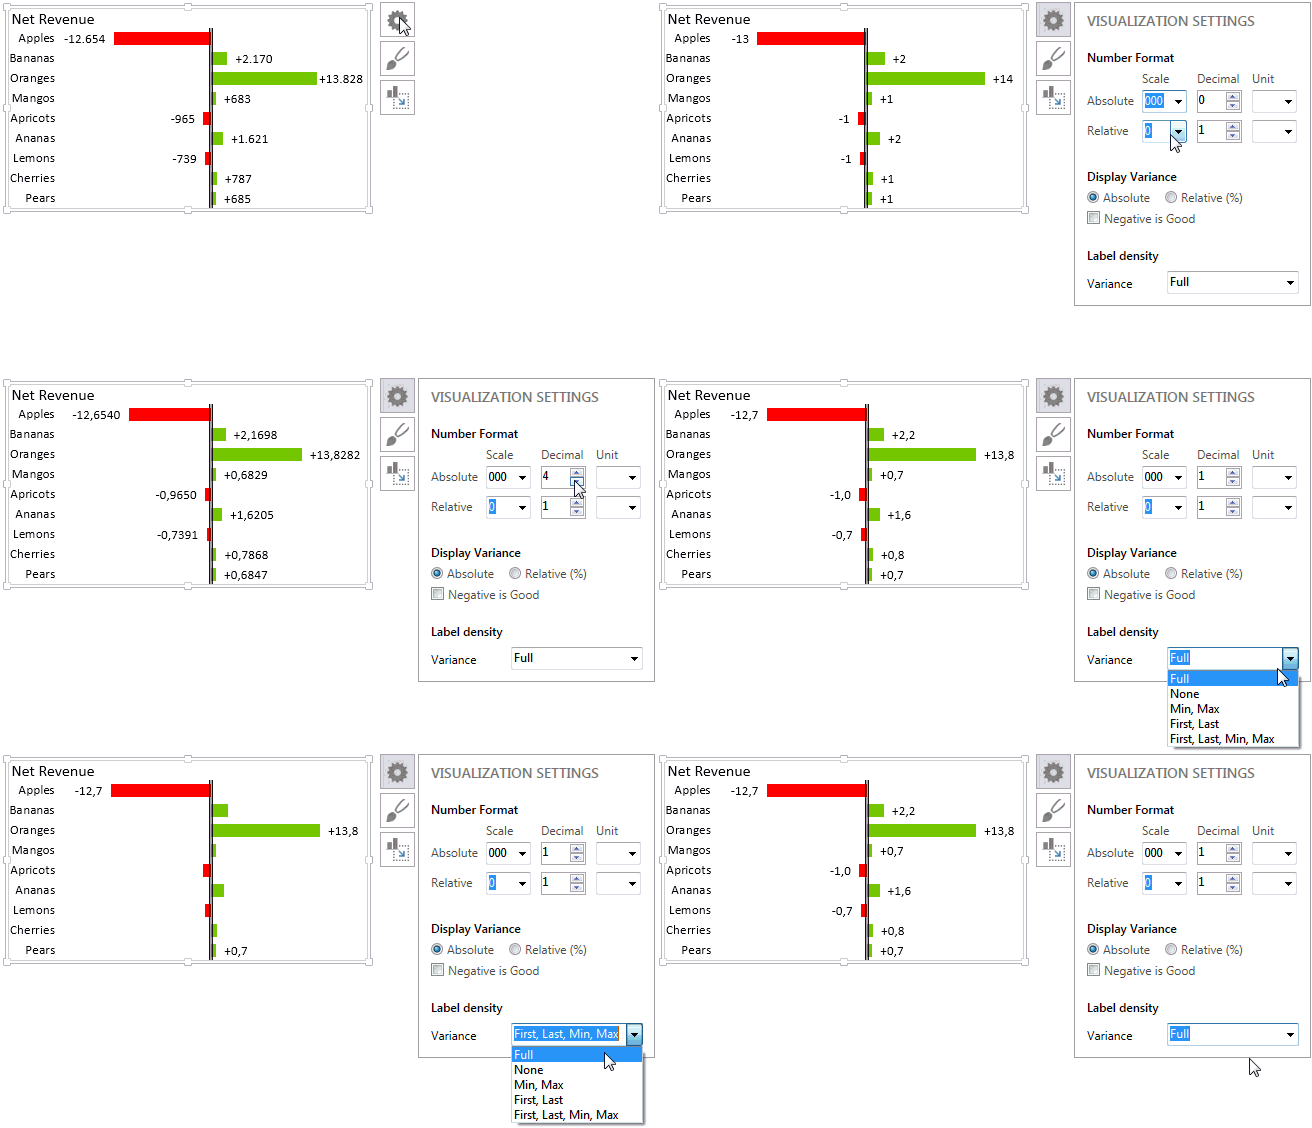
  • All charts now automatically adjust the space for labels, and it works with any number format:
Labels automatic formating

Automatic label adjustment

  • Vertical Part-to-Whole chart now displays series labels
  • Improved vertical Part-to-Whole chart
  • Improved horizontal Part-to-Whole chart
  • Improved labels on vertical Structure chart
  • Non-breaking space as thousands separator now fully supported
  • Fixed the bug with Freeze Panes
  • Fixed the bug with Chart Sheets
  • Other improvements in charts