The new Zebra BI for Office is now available! While we'll keep the old Zebra BI Excel add-in running, the future and major updates are in this new version. We recommend switching to get the best features.
To update your Zebra BI Dynamic Viewer click here.
Update Instructions:
1. Close all Excel windows
2. Run ZebraBI_setup.msi
3. Start Excel
… and enjoy the new features!
What’s New?
2.3.2
Fixed a bug that occurs when adding or clicking on a chart. This issue occurs in the latest version of Office and is caused by a bug in Excel. We have notified Microsoft about the problem and they are looking into it.
2.3.0
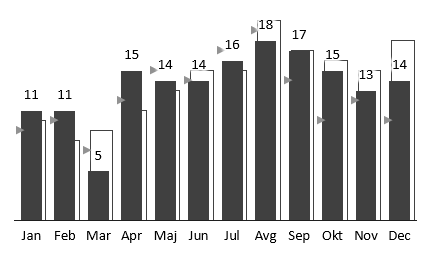
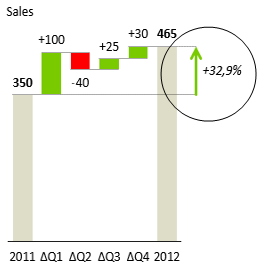
Added a new type of Time multiple series chart. It allows you to display one of the scenarios with small triangles. This is usually used for showing Previous Year scenario as depicted below.
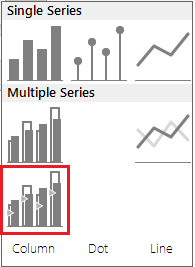
You can find it under Time charts:
Our bonus report templates are now included and are automatically installed for you!
Added an option to control relative format on Part whole charts so that you can control the number of decimal places for the relative difference highlight labels.
Added CHF to the list of symbols.
Improved German translations.
Improved data parsing for certain edge cases, especially when certain scenarios only have one value.
Fixed an issue with adding difference highlights on Part whole charts when they are a part of small multiples. Difference highlight is now correctly added to all the charts in the multiples.
Fixed an issue with linking min and max outliers to cells when Office is not using English language as default.
Fixed an issue with linking titles to cells when Office is not using English language as default.
Fixed a problem with difference highlights when using scale units on Part to whole charts.
2.2.9
Stability improvements.
2.2.8
Fixed an issue with zoom being set to 100% when moving charts.
2.2.7
Fixed a problem with inserting a Contribution chart from a single empty cell.
2.2.6
Improvements:
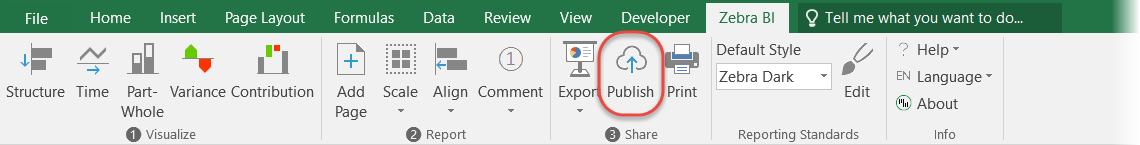
Remove the Publish to SharePoint button, since SharePoint support is deprecated.
2.2.5
Fixes:
Fix a problem with loading the reports. In some cases the regular Excel shapes get corrupted and cannot be accessed. We now ignore these shapes.
2.2.4
Fixes:
Fix a problem with the “Use variance colors for makers” setting. In some cases it wasn’t being saved.
Fix a problem with non braking space in Excel 2010.
2.2.3
Fixes:
Fix a problem with sometimes not being able to scale charts.
2.2.2
Improvements:
Improve the display of segments.
2.2.1
New Features:
You can now create segmented waterfall charts. Simply insert another column of data (for FC or BU, for example) and insert the chart as before.
“Move” functionality is now available for small multiple reports. Simply click the icon and move the small multiples exactly as you move single charts.
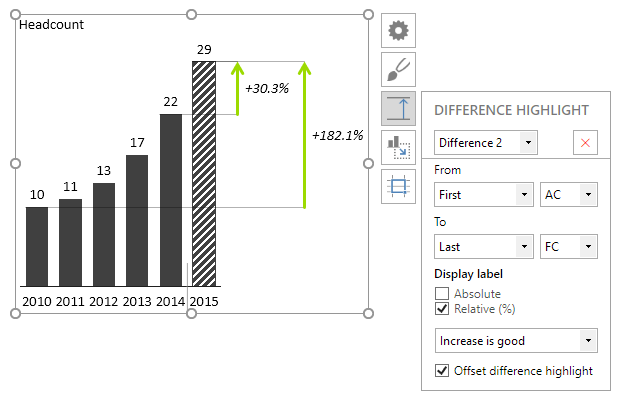
Now you can insert two difference highlights in charts. Click on the green “+” button to insert the second difference highlight.
Improvements:
The number of labels on limited outliers has been increased from 3 to 5.
Improved enterprise deployment.
Default to relative variance for lollipops.
Support the option of using three scenarios without actual.
Add the option for disabling italic on relative labels.
Add an option to use variance colors for dot markers.
Bug fixes:
Prevent Excel crashing during tutorial in certain cases.
Fix a problem with moving a chart when it is in a group.
Fix a problem with migrating hidden sheets.
Fix a problem with label density calculation when we have missing values.
Fix protected workbooks migrations.
Fix a problem with sorting contribution charts.
2.1.12
Bug fixes:
Solves an issue with the icon for French language.
2.1.11
New features:
Bonjour! Zebra BI now speaks French 🙂
Bug fixes:
Fixed a bug when scaling certain Waterfall charts.
2.1.10
New features:
Ciao! Zebra BI now speaks Italian 🙂
2.1.9
New Features:
Insert charts from multiple ranges. To insert Zebra BI charts from multiple ranges, just select all desired ranges by holding Ctrl key between selections and then insert a chart normally.
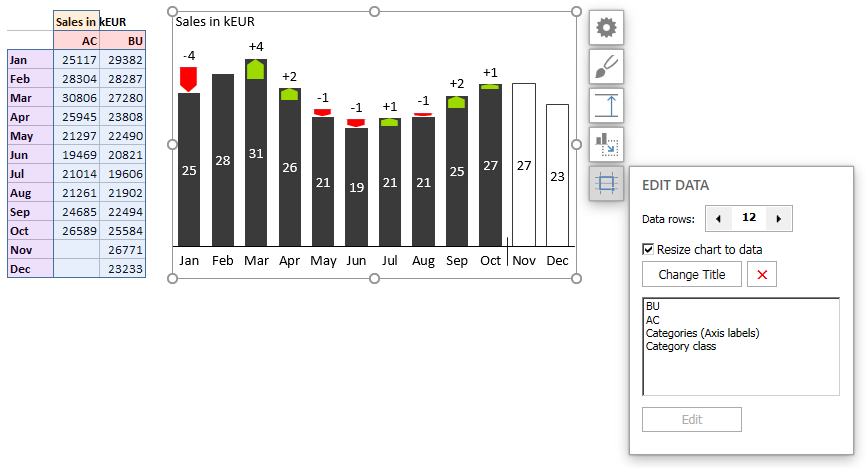
The Data Editor. This new button on Zebra BI charts allows you to change the source data of inserted charts. You can grow or shrink the chart or completely change the chart data to a different series.
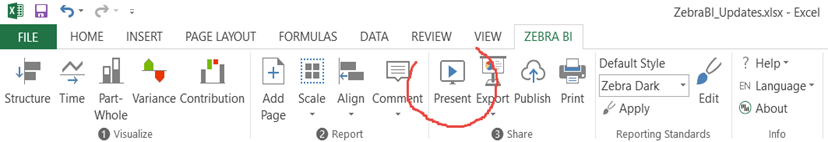
Full screen “Presentation” mode. Now you don’t have to leave your Excel – not even for presentations. Click “Present” in Zebra BI ribbon to activate “Presentation” mode:
Improvements:
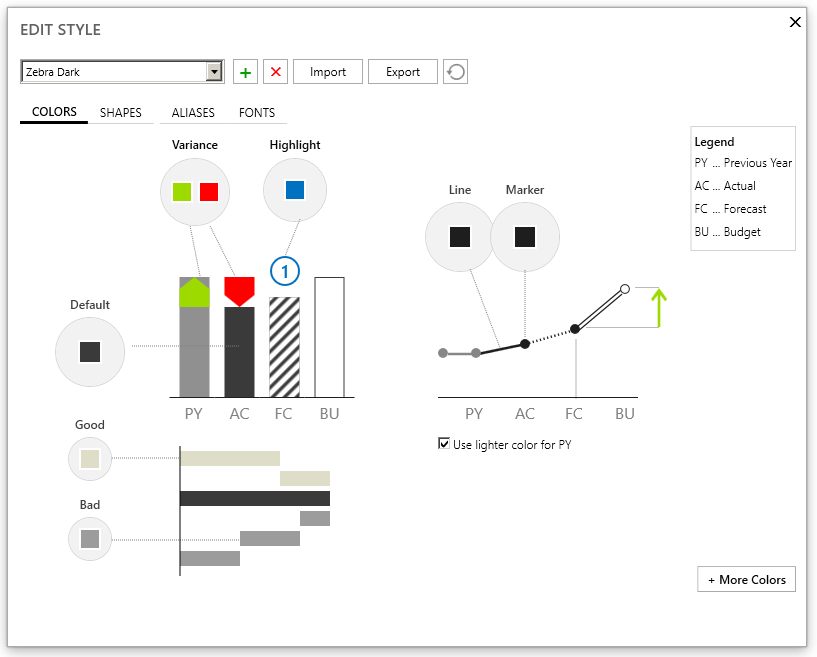
Completely revamped Style Editor! Now it’s easier than ever to create and manage your design styles. The leading motivation behind the redesign of Style Editor was to make it more intuitive to use. Click “Edit” in Zebra BI ribbon to access the new Style Editor.
Improved line charts. Now you can design two types of markers in line charts separately: inner and end markers.
Dynamic difference highlights. Now you can insert difference highlights to “dynamic” categories: First, Last, Next to last, Min, Max. You can also compare different scenarios on the charts that support multiple scenarios.
Improved parsing of chart data. Zebra BI is now much better at recognizing what the data represents.
Added support for date categories.
Added support for Chinese language.
Improved debug logging.
Bug fixes:
Fixed a problem with Variance Area charts when the first values were missing or #NA.
Fixed a problem with adding comments when multiple cells were selected.
Fixed a problem with chart settings icons disappearing after applying Styles to the whole Workbook or Worksheet.
Improved compatibility of Zebra BI with other Excel add-ins (especially built-in ones like Solver and Analysis Toolpak).
1.9.7
New Features:
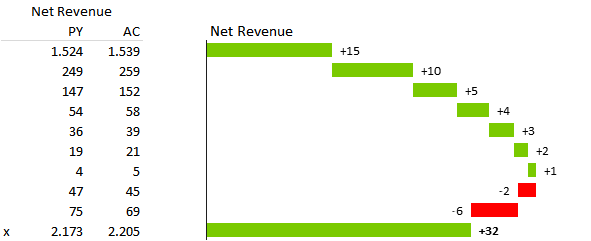
You can now break axis on waterfall charts! This is a slightly controversial, but highly useful feature.
With this feature, having too small changes compared to the totals won’t be a problem any more (on a waterfall chart). Now can use waterfall charts on any data – no matter how small the changes are.
Improvements:
Speed! Some of the functionalities of Zebra BI are now much faster. You will notice this especially on worksheets with a lot of scaled charts (for example, small multiples).
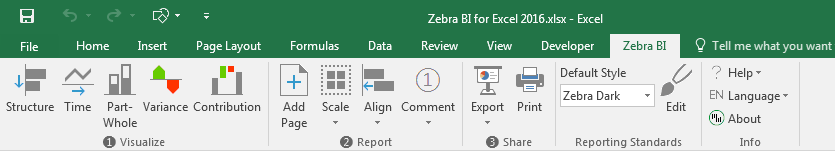
A new “Apply” button in Reporting Standards section of Zebra BI ribbon. Use this button to apply the selected style to all charts on the current worksheet or the entire workbook.
User interface improvements.
Cześć! Zebra BI now speaks Polish.
Bug fixes:
Fixed a lot of cases where Excel crashes (when inserting page templates, etc.)
Fixed the bug when “move chart form” didn’t display properly
The chart settings form now displays on the left if there’s not enough room on the right
Fixed a problem with percentage absolute scale format.
Fix a problem with setting fonts and colors when editing Styles
Fix a problem with applying styles to worksheets and workbooks
Fix label formatting for zeros on integrated variance chart
1.8.2
New Features:
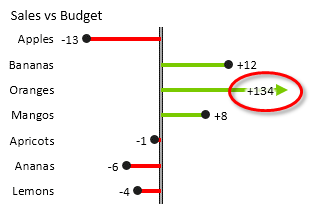
You can now add difference highlights to Zebra Charts! This allows you to quickly compare two categories.
The difference can be shown as relative, absolute or both and you can choose between multiple arrow Styles. Read all about this here.
Highlighting single values in charts is now much easier. Just hover over the column/bar and click the blue “+” button that appears. Find out more here.
Improvements:
Exporting as (static) Excel Workbook now supports two options: export with static charts and snapshot. Read more here.
Improved color picker on the Edit Style form.
Improved license activation.
Bug fixes:
Fixed a problem that could cause Excel to crash in the Getting started tutorial.
Fixed a problem with Workbooks that contain Chart Worksheets, which could prevent the users to add new Charts to the Workbook.
1.7.9
New Features:
You can now export your files to static Excel files. Your friends that do not have Zebra BI (yet :)) can also view them.
Improvements:
Improved export to PDF files. You can now choose the range of pages to export.
Improved the position of labels on Contribution charts.
Improved the position of chart settings forms in Excel 2016.
Improved the Getting Started Tutorial.
Bug fixes:
Fixed an issue with Excel 2016, 64 bit crashing when closing the application.
Fixed an issue that could cause Excel to crash when clicking on a chart when using Freeze panes.
1.7.8
New Features:
It is now much easier to send us Zebra BI diagnostic information. You can find it in the About window.
Improvements:
Improved export to PDF files. You can now choose between multiple options when exporting, also added support for exporting groups.
Improved publishing to SharePoint.
Improved Style renaming and adding new aliases to Styles.
1.7.7
Enhancements:
Improved position of labels on Contribution and Plus Minus Dot charts
1.7.4
New Features:
Publish to SharePoint enables publishing interactive Zebra BI reports and dashboards to Microsoft SharePoint 2013
Hundreds or even thousands of users can then access their dashboards with a standard web browser.
Enhancements:
Improved formatting of labels on the part-whole chart
1.6.2
New Features:
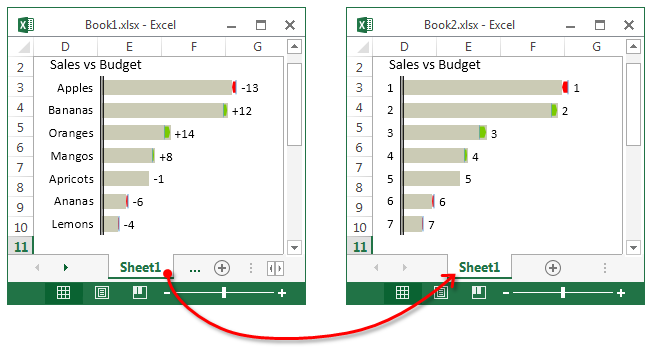
Zebra BI now supports copying and moving worksheets into another workbook (or a new workbook)!
This was one of your most frequent requests, so we’re very happy it now works natively. Just copy/move your sheets as you would normally do in Excel.
Move or Copy worksheet into another Excel workbook
Enhancements:
Improved formating of the outlier label:
Bug fixes:
Fixed the issue with inserting plus-minus chart from two rows
1.5.4
New Features:
Excel 2016 is out and Zebra BI now supports the 32-bit version of Excel 2016 (the 64-bit version will be fully supported in the next release of Zebra BI)
Здравствуйте, Zebra BI now speaks Russian. To switch to Russian, select Русский from Info > Language
Enhancements:
We’ve improved the label positioning on charts. Especially when the charts are small.
Scaling on plus minus charts now also takes inverted rows into consideration
Bug fixes:
Fixed an issue with changing the variance to relative on segmented plus minus dot charts
Fixed an issue on charts with multilevel categories which were not aligned if only the “-” symbols were used
Fixed a problem with scaling contribution (waterfall) charts (resizing the charts caused the axis to become too think or too thin)
1.4.4
New Features:
Zebra BI is now available in the Portuguese language!
Enhancements:
All charts now support multilevel axis labels
Improvements in label display on charts in Excel 2013
Improved commenting: the font for comment text boxes is now applied from the style
Stability improvements
Bug fixes:
Fixed a problem with Min and Max limit on plus-minus dot chart, created from one column
1.4.3
New Features:
Page Templates make it really easy for you to create standardized report pages or slides. We added several page templates for reports with multiple charts, classic table-chart combinations, ROI trees, etc. They are all perfectly sized to fit PowerPoint slides or scale exactly to A4 paper size. Just click “Add Page” and choose the most appropriate template! It gets even better, you can customize the templates or develop your own and then share it with other people.
Limiting outliers in plus-minus variance charts. Now you can set a limit for max or min value and every value that exceeds those limits gets cut off at the limit and displayed with an arrow instead.
The “Comment” section of the Zebra BI ribbon has been significantly expanded. The new additions include:
The ellipse for highlighting important values
The text-box for adding floating comments
The four IBCS “scenario markers” for formatting table columns
Four commonly used symbols (delta, sum, average and dot)
Eight arrow symbols for indicating trends
Enhancements:
The ability to move the legend from right to left in part-whole charts
The Croatian translation. If you’re a Croatian-speaking user, you can change your interface language in Info > Language in the Zebra BI ribbon.
Support for different PowerPoint slide sizes (classic 4:3 or widescreen 16:9)
Improved creation of linked PowerPoint slides
Bug fixes:
several bug fixes
1.3.2
New features:
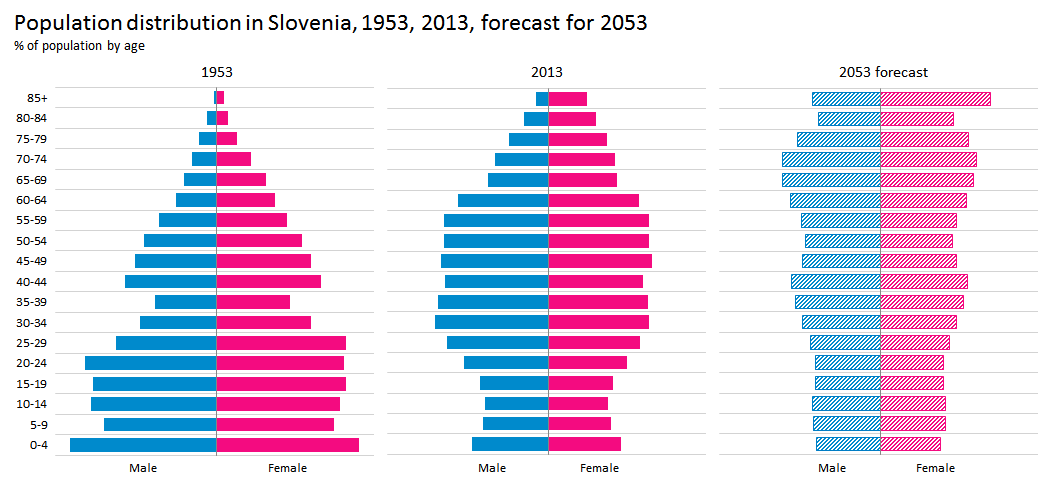
We’ve added the Butterfly chart! See examples in worksheet 8 in Help > Getting Started Tutorial
¡hola! Zebra BI now speaks Spanish.To switch to Spanish, select Español from Info > Language
Enhancements:
The contribution structure chart (black&white waterfall chart) is created as multiple chart if data for more scenarios is detected (e.g. two columns with PY and AC or AC and BU)
Bug fixes:
Fixed a problem with creating single series time charts that have all 4 scenarios (PY, AC, FC, BU) – data parsing is improved
Fixed a problem when inserting contribution (waterfall) chart which only had fixed column in the last row
1.2.3
New features:
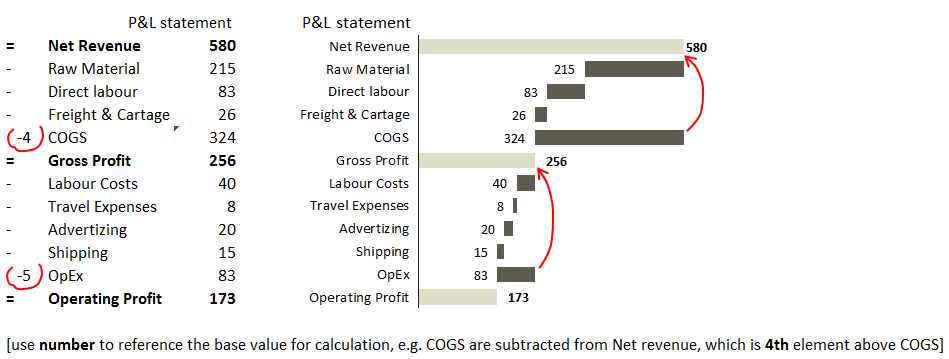
Contribution charts now support subtotals / subcalculations!
Enhancements: Added “=” as a fixed column identifier in waterfall charts (both “X” and “=” can now be used).
Improved logic for displaying Zebra BI context buttons
Added optical correction for displaying scenarios with very light colors (border)
Improved calculation engine check for 64bit versions of Excel.
Bug fixes:
Fixed a problem with sorting on worksheets with long worksheet names.
Fixed an issue with ref error when all data for a contribution chart is deleted.
Fixed an issue with semantic axis and delimiters when grouping Part Whole charts.
Fixed an issue with ungrouping Part Whole charts.
1.2.0
You can now copy any worksheet and then continue working on the copy with Zebra BI!
1.1.6
New features:
Completely new Getting Started Tutorial, available under Help > Getting Started Tutorial:
You simply must try this! Test yourself: do you know all the key features of Zebra BI?
Enhancements:Improved data parsing for part-whole, contribution and variance charts
Improved positioning of chart and report settings icons while moving charts.
Improved positioning of charts and reports when they are created
Improved Move Chart function.
Improved design of user forms.
Bug fixes:Fixed #REF errors ocurring in some cases when Excel worksheets were deleted
Fixed a problem with grouping waterfall charts without categories.
Fixed the legends in part whole chart when the series do not have names (empty legend).
Fixed a problem with grouping and ungrouping multiple structure charts.
Fixed axis labels position on structure charts when in multiples.
Fixed the axis label position on time charts when ungrouping.
1.1.4
improved data recognition for the Contribution chart without categories, e.g.:
improved localizations on Zebra BI ribbon
1.1.3
improved application of borders to Plus minus and Contribution chart
improved the speed of manually grouping the Charts
improved positioning of the Charts in Small Multiples
improved positioning of Small Multiples report when it is inserted
demo and updates Workbooks are now included with the installation
added a check to see if the decimal symbol and group separator use the same character
fixed an issue with copying between Workbooks
fixed an issue with relative variance calculation
fixed an issue with the patterns not applying after changing them in the Styles window
1.1.1
fixed an issue with copying the ranges between Excel workbooks
1.1.0
Significant speed improvements – small multiples and groups of several scaled charts now work up to 10x faster
All charts now automatically adjust the space for labels, and it works with any number format:
Automatic label adjustment
Vertical Part-to-Whole chart now displays series labels
Improved vertical Part-to-Whole chart
Improved horizontal Part-to-Whole chart
Improved labels on vertical Structure chart
Non-breaking space as thousands separator now fully supported
The new Zebra BI for Office is now available! While we’ll keep the old Zebra BI Excel add-in running, the future and major updates are in this new version. We recommend switching to get the best features. Learn more