
Time Series Analysis
Time series analysis is performed when the data categories represent time (years, quarters, months, weeks, days). You should always visualize time series with horizontally oriented charts (naturally ordered left to right). Zebra BI offers the following visualizations of time series data:
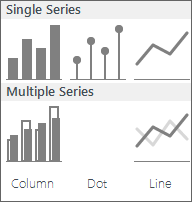
Time Series charts in Zebra BI
Single Series (one data scenario)
Let us start with the most basic time-series chart. Click anywhere inside your data table and select the column chart:
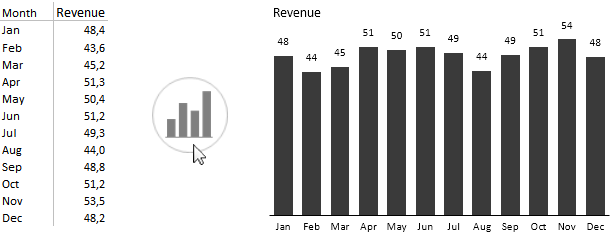
Time Series – a basic chart, inserted from a vertical table
Zebra BI also allows you to insert time charts from horizontal tables (time elements in columns, not in rows):
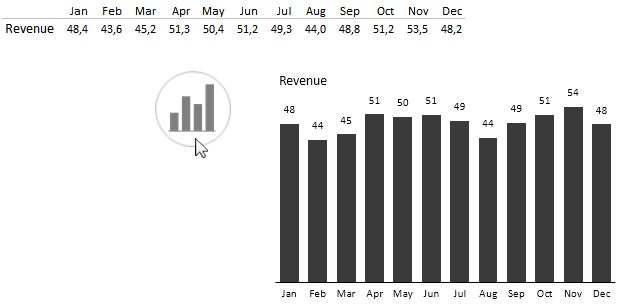
Time Series – a basic chart inserted from a horizontal table
In exactly the same way you can insert a “Pin” chart (dot chart with vertical lines) or a line chart:
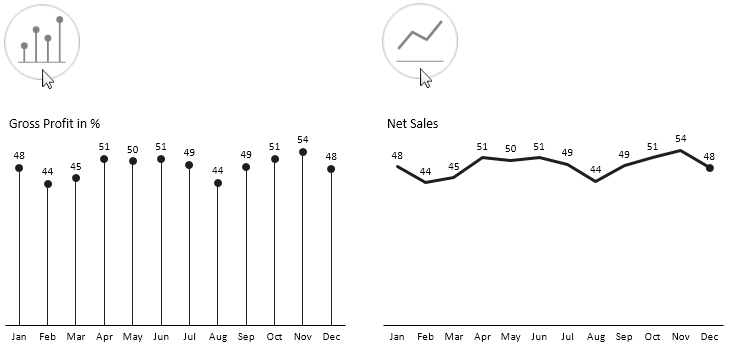
Time Series – “Pin” chart and line chart
If you expect the users to mostly compare single values, then you should consider using Columns or Dots. In case the user is expected to analyze trends, you should consider inserting a Line chart instead (especially on smaller charts!). To learn more about which chart to use, read the article Which chart should I use? 3 fundamental rules.
Now, you probably know that Zebra BI understands the concept of data scenarios (Actual, Budget, Forecast, Previous year). To display time-series charts for a particular scenario, just write the scenario label (e.g. AC, BU, FC, PY, etc.) in the column header of your data table and Zebra BI will automatically apply the corresponding scenario pattern (exactly as defined in your current Style):
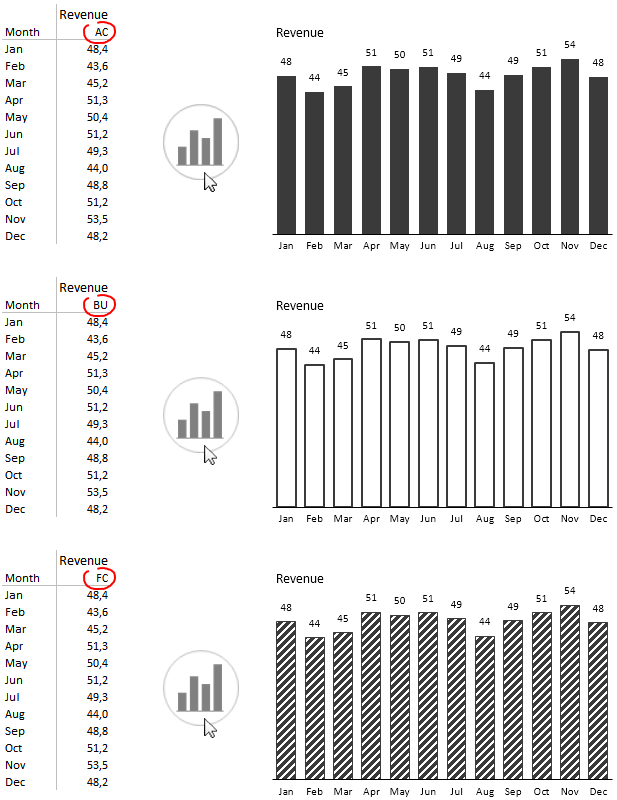
Time Series charts – scenario coding
Single Series with scenario segments
If you have data for more data scenarios, such as for example Actual values until August and Budget (Target) values for the whole year, then Zebra BI will produce a Single time series analysis as a chart with more data scenarios aligned in a single time series. To achieve this, place your data for each scenario in a separated column and give the column header the right name (e.g. AC, BU, FC, PY):
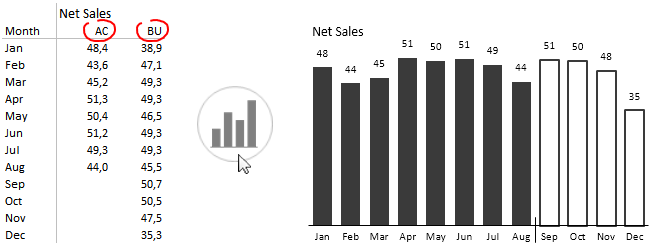
Time-Series chart – Actual and budget
If you want to add scenario labels to the chart (below axis labels), just place them at the appropriate position in a separate category class column next to your categories (in our case months) and then insert your chart:
Time-Series chart – two scenarios with labels
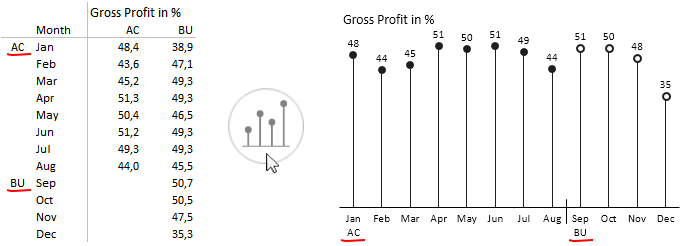
This works even with 3 data scenarios. E.g.:
Times-Series charts with 3 scenarios
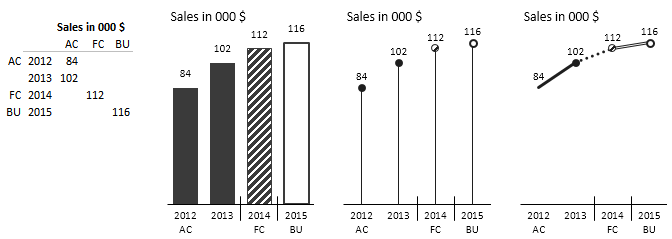
Here is another example, this time monthly values for 2 years with 3 scenario segments (actual, forecast and budget) and with an extended label “BU 2015” to label next year’s budget:
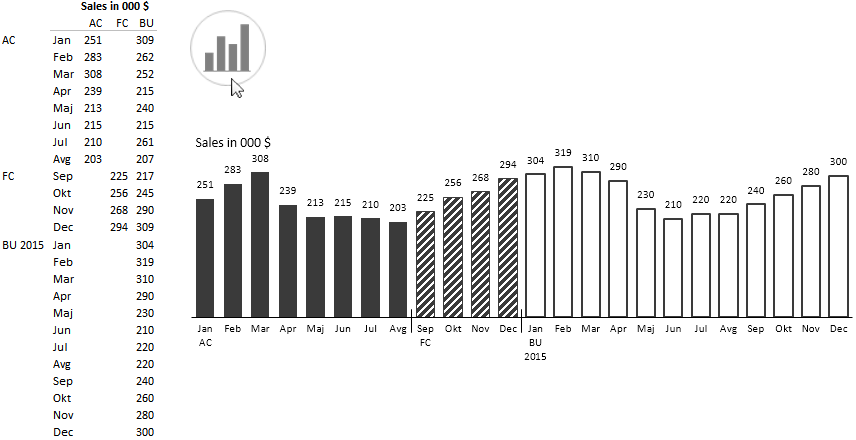
Time-Series chart – Actual, forecast and budget in 2 years
Multiple Series
Similar to time-series charts with scenario segments, you can also insert charts with two separate series that are partially overlapping. For example to show actual values compared to budget values or actual values compared to previous year values:
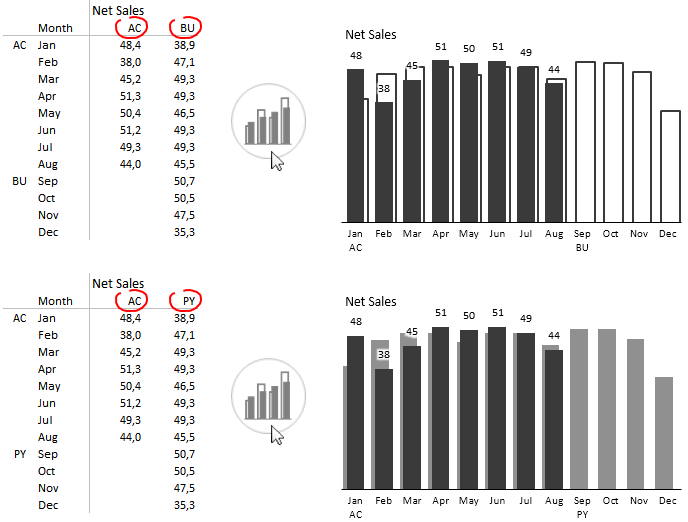
Time-Series charts with 2 series
Note that the budget columns are always displayed to the right of actual columns, while previous year columns are displayed to the left of actual columns.
Here is how these two comparisons would look like in a line chart:
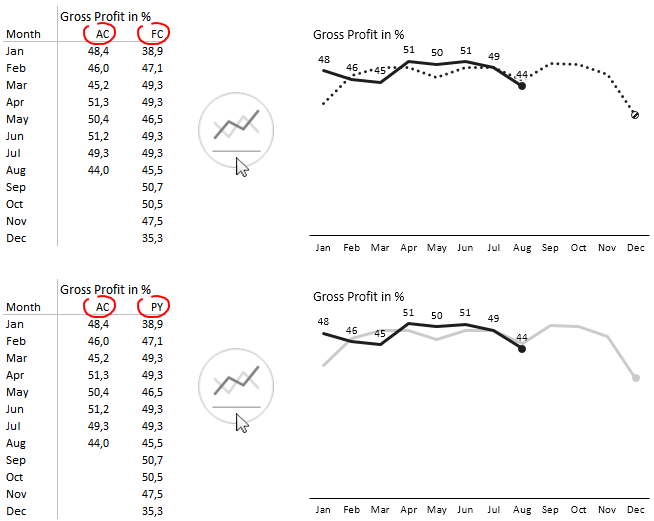
Time-Series line chart with 2 scenarios
What’s next?