
Using Zebra BI Data Editor
In Zebra BI 2.0 we introduced a Data Editor – a new button on Zebra BI charts that allows you to change the source data of inserted charts.
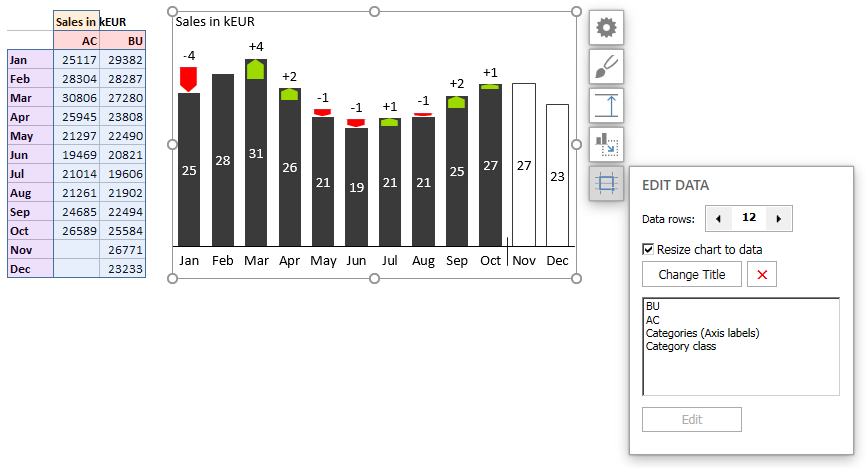
This is what you see when you click on the Data Editor button:
There are two main uses of the data editor:
1. Grow or shrink Zebra BI charts
If you want to add additional data category to the chart, for example years, months, business units, etc., simply click on the < and > buttons in the data editor to decrease or increase the number of data rows.
Watch the animation below to see it in action:
Note: With the check mark “Resize chart to data” you let the chart size adjust for the new/removed categories or keep the chart size fixed.
2. Change chart source
The second use of the data editor is to change the source of chart data to a different series. Here’s how it works:
Note: The new source data can also be on a completely separate worksheet. This means you can have your charts on one sheet and keep all your data on another sheet.