
Welcome to Zebra BI!
After having completed the installation process, you can now start using Zebra BI. First, start MS Excel – a new tab called Zebra BI will be presented at the rightmost side of your Excel ribbon:
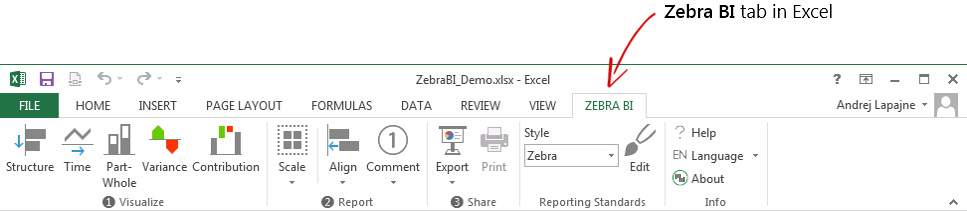
Zebra BI ribbon in Excel
NOTE: In Excel 2010, 2013 and 2016 the ribbons look slightly.
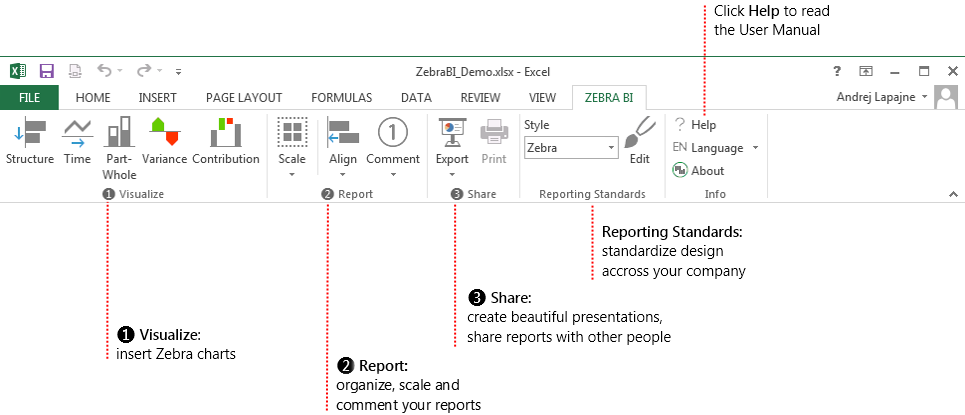
You can see that the Zebra BI ribbon is divided into 5 groups:
- Visualize allows you to insert Zebra charts
- Report lets you organize, scale and comment on your reports
- Share makes it super easy to create business presentations and share your awesome reports with other people
- Reporting Standards will assure that all your charts and reports are consistently designed throughout your company
- Info provides help and allows you to change the language settings
Great, now you are ready to start creating your own Zebra charts!
We hope you’ll enjoy designing professional reports with Zebra BI!
Read next: