
Structure Analysis
Structure analysis is the most basic analytic task: The reader observes the displayed values and visually compares data categories to each other. These comparisons are usually of the following nature:
- Looking up a specific value (e.g. finding the sales value of a specific product)
- Comparing two values
- Ranking (trying to establish the sequential order of one or more data categories)
- Observing patterns in the data (subsets of values with a specific pattern)
With Zebra BI you can insert the following structure visualizations:
Structure charts in Zebra BI
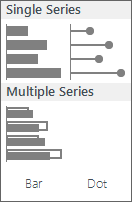
Single Series (one data scenario)
Let us start with the most basic structure chart. Click anywhere inside your data table and select the bar chart:
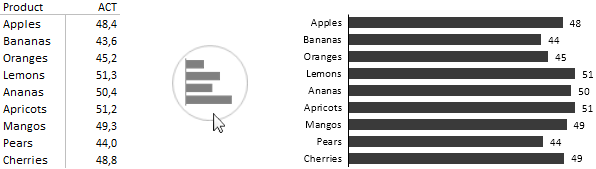
Structure Chart – a basic chart, inserted from a vertical table
Zebra BI also allows you to insert structure charts from horizontal tables, with structure elements in columns, not in rows (however, this is not considered a good practice so you should try to avoid it):
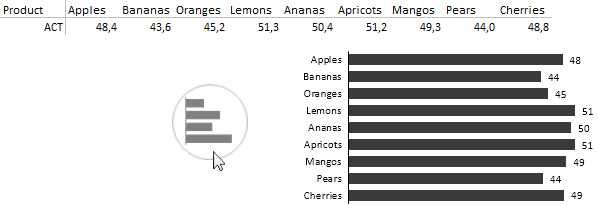
Structure Chart – a basic chart, inserted from a horizontal table
In exactly the same way you can insert a “Pin” chart (dot chart with horizontal lines):
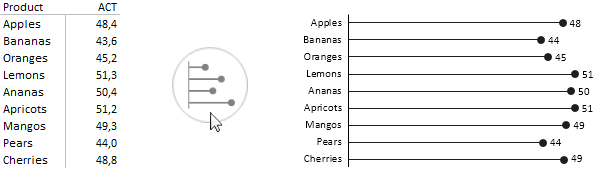
Structure “Pin” Chart
Now, you probably know that Zebra BI understands the concept of data scenarios (Actual, Budget, Forecast, Previous year). To display structure charts for a particular scenario, just write the scenario label (e.g. AC, BU, FC, PY, etc.) in the column header of your data table and Zebra BI will automatically apply the corresponding scenario pattern (exactly as defined in your current Style):
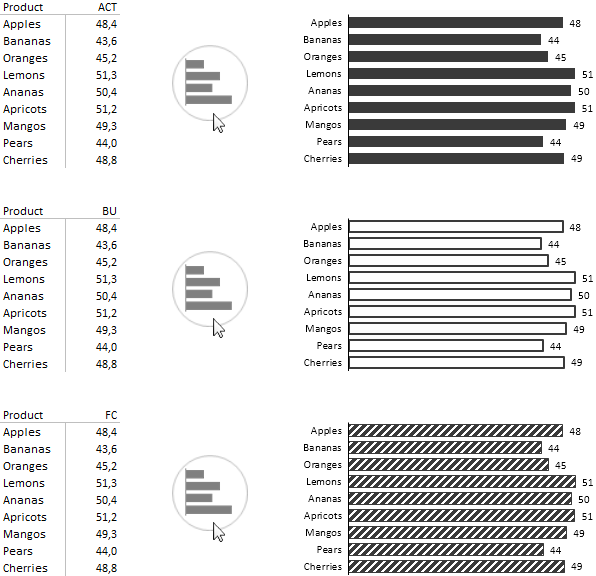
Structure Charts – Scenario Coding
Multiple Series
You can also insert structure charts with two separate series that are partially overlapping. For example, to show actual values compared to budget or actual values compared to previous year values:
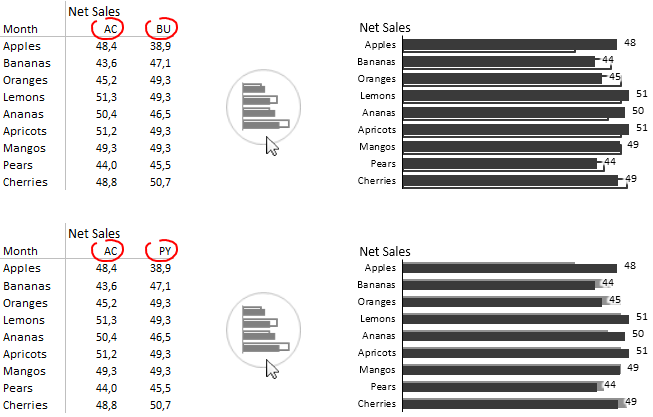
Structure Charts with 2 series
What’s next?