
How to grow Zebra BI charts
Sometimes you’d like to add new data (new months, new products, …) to the Zebra BI charts. There are 3 ways you can do that, depending on whether you want to add new data categories at the end of the chart or in the middle.
Using Zebra BI Data Editor to grow charts
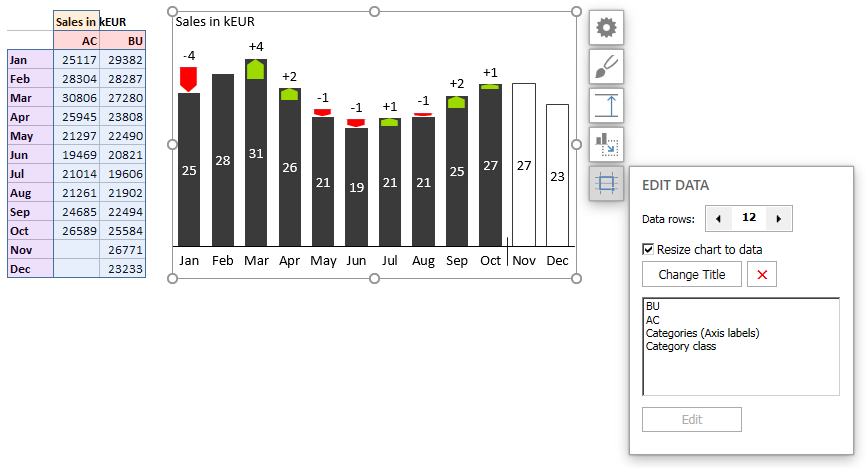
Since Zebra BI 2.0 you can use the built-in Data Editor to add new data categories (for example years, months, business units, etc.) at the end of the chart.
Simply click on the < and > buttons in the data editor to decrease or increase the number of data rows.
You can read more about using Zebra BI Data Editor here: https://support.zebrabi.com/data-editor/.
Inserting full rows/columns
If you wish to add new data categories in the middle of the chart, simply add new full rows or columns inside the data range that a Zebra BI chart was created from. The chart will resize accordingly.
Inserting individual cells
In some situations you can’t insert full rows or columns because of the structure of your worksheet. Inserting individual cells works as well, the only difference is that you have to resize the chart afterwards.
